Gross Margin RatioExplained & How to Calculate


Cindy sells apples within her neighborhood.
Every day, she goes to the market to buy fresh apples that she will later sell at her stall.
On a certain day, she buys 50 apples at $1 each piece (a total of $50).
She later sells all of the apples for a total of $100.
In the above scenario, how much do you think Cindy truly earned from her sale of apples?
Is it $100, the total selling price of her apples?
Or is it $50, which is the figure we arrive at after considering the cost of the apples?
Well, when we only talk about revenue, it’s the full amount of $100.
But Cindy did spend $50 to acquire the apples that she later sold.
So at the end of the day, Cindy only truly earns $50 from her sale of apples.
The example above is a simple one, but it’s enough to convey that earning revenue isn’t the ultimate goal of a business.
It’s earning a profit.
A business may generate any amount of revenue but if it does not cover the costs of generating such revenue, the business won’t be making any profit.
If Cindy sold the apples for only a total of $50 or less, she wouldn’t earn anything at all.
Generating revenue is important, but that’s only the start.
The business still has to consider its costs and operating expenses, as well as other expenses.
Only then will the business know if it truly earned any profit at all.
The first metric of profitability that you’ll find on an income statement is gross profit.
It’s the figure you arrive at after deducting the cost of sales from revenue.
In this article, we will be taking a closer look at it along with the gross margin ratio.
What is Gross Profit?

Gross profit (a.k.a. sales profit or gross income) is the amount that a business earns from its sales after considering the costs to generate such sales.
For example, when a business sells a product, the cost of the product sold is deducted from the revenue earned to arrive at the gross profit of such a sale.
The gross profit is useful in determining how much profit a business earns from its sales (before considering operating expenses).
In addition, the gross profit is useful in assessing the operational efficiency of the business.
The higher the gross profit is relative to revenue, the better the business’ operational efficiency is.
It also tells if the business’s offerings are profitable.
If the costs of selling goods or performing services exceed the revenue earned from them, the business won’t be making any profit no matter how much it sells.
In such a case, the business may want to reconsider its offerings.
Maybe the sales price is too low?
Or maybe it’s overspending on costs?
Either way, you would want your business to have a positive gross profit.
For internal users (e.g. the management team), gross profit is a useful tool in assessing the profitability of certain products.
Some internal income statements may even segregate the revenue and cost of sales of each product.
That way, the management can assess which products are earning and which are not.
From there, they can decide whether or not to continue selling the products that don’t earn.
All in all, you would want your business’s income statement to have a positive gross profit.
This means that it was able to generate enough revenue to cover all costs of sales, and then still have some extra to cover other expenses (operating and non-operating expenses).
What is the Gross Margin Ratio?
The gross margin ratio (a.k.a. gross profit ratio, gross profit margin, or gross margin) is one of the profitability ratios.
It measures how much gross profit a business earns relative to the revenue it generates.
It also indirectly measures how efficient the business is at managing the costs of generating revenue.
More particularly, the gross margin ratio measure how much gross profit a business earns for every dollar of revenue.
It’s typically presented in percentage form.
For example, if a business has a gross margin ratio of 35%, that means that it earns $0.35 for every dollar of revenue/sale.
In some cases, the business may compute the gross margin ratio of each product that it offers.
The gross profit margin may be more helpful in assessing a business’s operational efficiency than just the gross profit.
Gross profit shows a dollar amount, while the gross profit margin shows a percentage.
For example, let’s say that a business offers two products: Brand A and Brand B.
A unit of Brand A costs $150 to acquire and currently sells at $200 per unit.
Meanwhile, it costs $80 to acquire a unit of Brand B, which currently sells at $120 per unit.
Calculating the gross profit of each product, we get $50 gross profit for a unit of Brand A, while a unit of Brand B generates a gross profit of $40.
Looking at just the gross profit amounts, you would say that Brand A is better.
But it may not be the case in terms of efficiency.
If we calculate the gross margin ratio of each product, Brand A will have 25% ($50 ÷ $200) while Brand B will have 33.33% ($40 ÷ $120).
Based on this, it’s more efficient to sell units of Brand B.
Speaking of calculating the gross margin ratio…
Calculating the Gross Margin Ratio
Calculating the gross margin ratio is simple. You only need to divide the business’s gross profit over its total revenue.
Put into formula form, it should look like this:
Gross Margin Ratio = Gross Profit ÷ Revenue
Where:
Gross Profit = Revenue – Cost of Sales
You can usually find both revenue and cost of sales figures on a business’s income statement.
To better familiarize ourselves with the formula, let’s do some exercises.
Exercise#1
Misty owns a bakery. In 2021, the bakery earned a total of $250,000 revenue.
The costs to generate such a level of revenue amount to $100,000.
Misty wants to know how efficient her bakery is in generating gross profits in 2021.
To do so, we need to compute the bakery’s gross margin ratio.
First, let’s calculate the gross profit:
Gross Profit = Revenue – Cost of Sales
= $250,000 – $100,000
= $150,000
Now that we have the gross profit, we can proceed with the calculation of the gross margin ratio:
Gross Margin Ratio = Gross Profit ÷ Revenue
= $150,000 ÷ $250,000
= 60%
As per computation, Misty’s bakery has a gross margin ratio of 60% in 2021.
This means that for every dollar that the bakery earned in revenue, it earned a gross profit of $0.60
Exercise#2
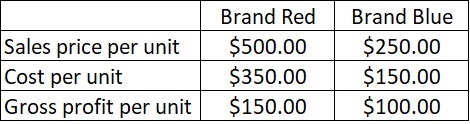
The Ash company is currently selling two types of products: Brand Red and Brand Blue.
The table below contains certain data regarding the two products:
The Ash company is planning to increase the production of one of the two products.
However, the management is unsure which product should increase production.
One thing they’re sure of is that they will choose the product with more potential to earn for every dollar of revenue.
To get such information, we need to calculate the gross margin ratio of each product.
Only then can we compare the two.
First, let’s calculate the gross margin ratio of Brand Red:
Gross Margin Ratio is calculated by dividing your Gross Profit by your total Revenue.
= $150 ÷ $500
= 30%
Next, let’s calculate the gross margin ratio of Brand Blue:
Gross Margin Ratio = Gross Profit ÷ Revenue
= $100 ÷ $250
= 40%
As per our calculations, Brand Red has a gross margin ratio of 30% while Brand Blue has 40%.
Comparing the two, while Brand Blue has the lower gross profit per unit, it earns more gross profit per dollar of sale.
As such, it is recommended for the Ash company to increase the production of Brand Blue.
How to Increase the Gross Margin Ratio
The gross margin ratio is a profitability ratio that measures how much gross profit a business earns for every dollar of revenue.
Gross profit is calculated by deducting the cost of sales from the revenue.
From these two statements, we can derive two ways to increase the gross profit margin ratio.
The first is to increase the sales price of the products.
The other is to decrease the cost of sales.
Increase the sales price of products
Increasing the sales price of your products effectively increases the revenue you earn from each sale.
This means that you earn more from each sale.
However, take caution when increasing the sales price of your products.
Overdo it and you might actually lose revenue due to a decrease in the volume of sales.
Be sure to increase the sales price without compromising the volume of sales.
Decrease the cost of sales
The other way is to reduce the cost of sales.
This can be done in many ways such as availing purchase discounts when purchasing in bulk, or looking for another supplier that sells the same materials you need at a lower price.
Lowering the cost of sales means that there are fewer costs that eat up the revenue.
This means that it increases the gross profit, ultimately increasing the gross margin ratio.
What is a “Good” Gross Margin Ratio?

There is only one universal truth in regards to a “good” gross margin ratio.
It’s that it shouldn’t be negative, as a negative gross margin ratio means that the business isn’t earning from its offerings.
Other than that, it will depend on the industry that the business belongs to.
Businesses within industries that generally have a low cost of sales are expected to have high gross margin ratios.
This mostly applies to businesses that solely sell services.
On the other hand, those that belong within industries that generally have a high cost of sales will have lower gross margin ratios.
For example, those within the fast food industry usually have a gross margin ratio of 40% to 50%.
That’s why when comparing the gross margin ratios of two businesses, make sure that they’re within the same industry.
That said, the gross margin ratio isn’t the only measure of profitability.
In fact, a business can have a high gross margin ratio, yet it may still end up with a low or even negative net income.
The gross margin ratio is the best to rely on when assessing the profitability of the business’s offerings.
However, it’s not necessarily the best measure of a business’s overall profitability.
For that, we need to rely on the other measures of profitability which are the operating income and net income.
FundsNet requires Contributors, Writers and Authors to use Primary Sources to source and cite their work. These Sources include White Papers, Government Information & Data, Original Reporting and Interviews from Industry Experts. Reputable Publishers are also sourced and cited where appropriate. Learn more about the standards we follow in producing Accurate, Unbiased and Researched Content in our editorial policy.
Penn State "What's the Difference Between Markup and Profit?" Page 1 . April 4, 2022
Southern Utah University "Balance Sheet Ratios" Page 1 . April 4, 2022
Harvard Business School "2 WAYS TO INCREASE PROFIT MARGIN USING VALUE-BASED PRICING" Page 1 . April 4, 2022