Return on Assets (ROA)Meaning, Definition, How to Calculate & Formula


As your business continues its operations and existence, it will be accumulating items that increase its value.
These items that increase your business’s value appear in its financial statements, particularly the balance sheet, as assets.
These assets that are found in the balance sheet, along with other non-quantifiable value-adding items (e.g. internally generated goodwill, human resources, etc.) are what bring in the money to the business.
One of the main purposes of running a business is to generate profit after all.
Some of these assets, such as manufacturing and equipment, directly contribute to the operations of the business.
Eventually, they directly contribute to the generation of profits.
Other assets, such as the building that houses said machinery and equipment, indirectly contribute to the generation of profits.
Either way, assets are typically acquired with the expectation that they’d increase a business’s value through the generation of profits.
As a business owner, you should know how much income your business is earning relative to its total assets.
You would want to gauge the efficiency of business operations, and one way to do it is to measure how much income is produced by your business’s assets.
Not only will it help you in identifying whether you’re making the right investments (assets) for your business, it can also help you in future business decisions.
Fortunately, there is a ratio that does exactly that: measure how much income is earned relative to a business’s assets.
This is ratio is called the Return on Assets (ROA).
In this article, we will discuss what Return on Assets (ROA) is and its significance to your business.
We will also be discussing its formula along with an exercise so that you can familiarize yourself with its computation.

What is Return on Assets (ROA)?
Return on assets (ROA) is a financial ratio that measures how much income is generated relative to a business’s assets.
You can also look at it as a measurement of the returns to a business’s investments (assets).
It is one of the ratios that measure a business’s profitability.
It can also be referred to as the Return on Total Assets.
ROA is a useful tool for management as it measures how efficient the business is in converting its assets into profits.
The higher the ROA is, the more efficient a business is in generating returns to its investments (assets).
It is best used when compared to previous periods’ ROA.
Doing so will let you see if it has increased or decreased, which helps in deciding whether certain operating policies should be kept as is, or be modified.
Aside from that, it also helps in assessing whether you made the right investments, as well as identifying the not-so-good ones.
As a ratio, ROA is typically presented in percentage form.
For example, if a business has a ROA of 15%, that means that for every $1 of assets it has, it generates a profit of $0.15.
The higher the ROA is, the better.
If a business’s ROA is historically growing, then that could signify that the business is making the right business decisions in terms of operations and investments.
It means that over the years, the business is earning more profits relative to its assets.
However, if ROA is historically decreasing, that means that the business is declining.
Its management must assess why that is happening.
As a business owner, you would want your ROA to be steadily growing.
At the very least, make sure that it’s not declining for consecutive periods.
ROA and its significance to your business
ROA is important for a business as it is one of the financial ratios that measure profitability.
As already mentioned, one of the main purposes of running a business is to generate profits.
ROA measures how effective a business is in converting its assets into income.
Investors use ROA, along with other ratios, to assess whether it’s worth it to invest in the business or not.
It gives them an idea of how effective the business is in converting the investments they make into income.
For example, a business with a high ROA is more attractive to investors than a business that has more assets but a lower ROA (assuming they’re within the same industry).
Essentially, if your business has a good ROA, it is more likely to attract investors.
As for the business itself, ROA provides the ability to compare it with other businesses (within the same industry) even if said businesses are not of the same size.
Since ROA is typically presented in percentage form, it mostly doesn’t matter if business A has $10,000 assets, while business B has $50,000.
This is useful not only for assessing the competitiveness of the business but also for confirming whether it is growing in the right direction or not.
ROA also helps in improving a business’s future operational performance.
It can be used to measure the growth of a business by comparing the current ROA to previous periods’ ROA.
The business can then use the historical ROA to set the goal ROA for the years to come.
For example, a business’s current ROA is at 10%. For the past five years, the business’s ROA has increased by 10% yearly.
As such, the business expects that the next year’s ROA will at least be 11%.
The ROA formula
Computing for ROA is quite simple.
You only need to gather two figures: the net income and average total assets.
Net income can be found on the income statement.
The figure for average total assets cannot be immediately found on a financial statement.
Rather, it can be acquired by computing the average between the beginning and ending balances of assets found on a balance sheet.
Alternatively, the ending balance of total assets can be used instead of the average total assets.
ROA can be computed by using the following formula:
ROA = Net Income ÷ Average Total Assets
-or-
ROA = Net Income ÷ Ending Balance of Total Assets
Some variations can be made with the formula to address some issues.
Since ROA accounts for the capital that is provided by both debt and equity, some analysts reason that the interest expense should be added back to net income.
This is so that ROA can more accurately reflect the rate of return to the business’s capital sources (debt and equity).
The modified formula will then be:
ROA = ((Net Income + (Interest Expense x (1 – Tax Rate))) ÷ Average Total Assets
-or-
ROA = ((NI + (I x (1-T))) ÷ Average Total Assets
Where:
ROA = Return on assets
NI = Net income
I = Interest expense
T = Tax rate
Calculating ROA
To deepen our understanding of the formula, let’s do an exercise. For that, We will be using the following income statement and balance sheet:

These are the 2020 financial statements of Intel Corporation. Let’s compute Intel Corporation’s ROA for 2020.
First, we need to gather the following:
- Net income
- Beginning and ending balances of total assets
From the income statement, we gather the net income figure:
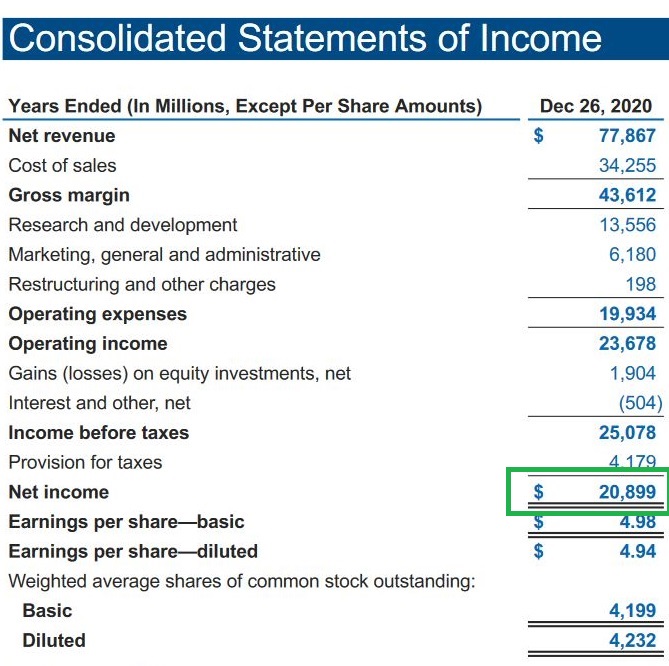
As shown above, Intel Corporation’s net income for 2020 is $20,899,000,000.
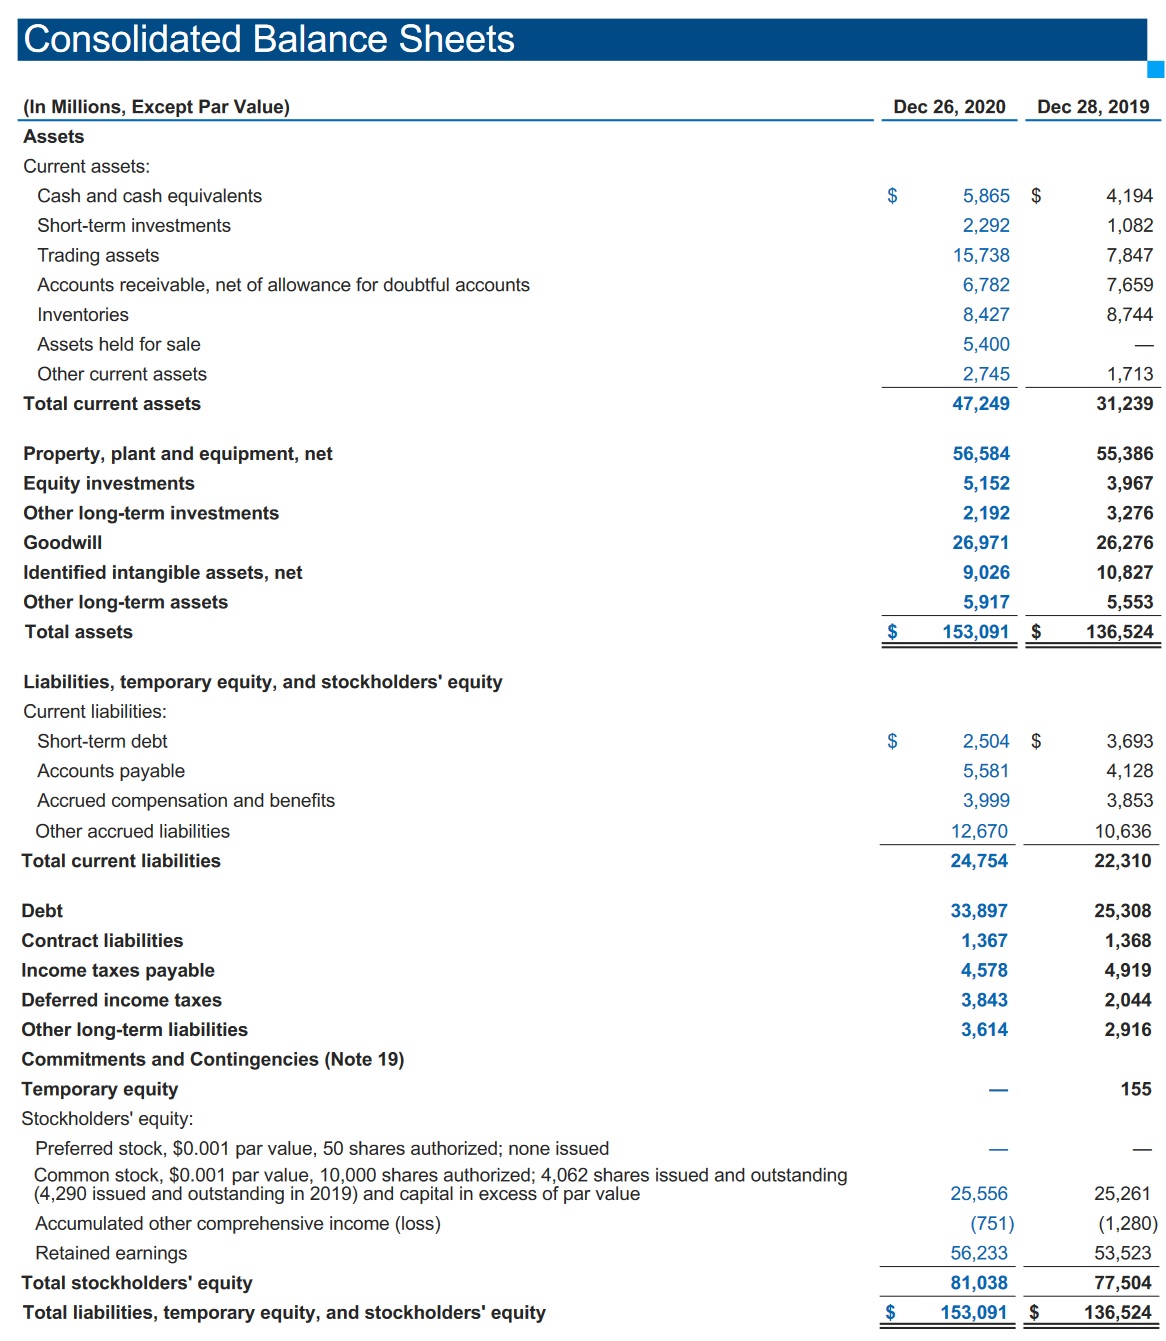
Next, to get our average total assets figure, we gather the beginning and ending balances of total assets from the balance sheet:

For the beginning balance, we refer to the ending balance of the previous year.
As such, we will be using 2019’s ending balance for total assets which is $136,524,000,000 as 2020’s beginning balance.
For the ending balance, the figure is $153,091,000,000.
Now that we have our net income and total assets figures, we can proceed with the calculation of ROA:
Return on Assets (ROA) is calculated by dividing a company’s net income by its average total assets: ROA = Net Income ÷ Average Total Assets.
= $20,899,000,000 ÷ ($136,524,000,000 + $153,091,000,000)/2
= $20,899,000,000 ÷ $144,807,500,000
= 14.43%
As per computation, Intel Corporation’s ROA for 2020 is 14.43%.
This means that for every $1 of assets it has, it earns $0.14 net income.
Alternatively, we can use the ending balance of total assets instead of the average:
ROA = Net Income ÷ Ending Balance of Total Assets
= $20,899,000,000 ÷ $153,091,000,000
= 13.65%
Return on Assets (ROA) vs Return on Equity (ROE)
Return on Assets (ROA) and Return on Equity (ROE) are both ratios that measure a business’s profitability.
The main difference between the two is the figure in which they relate the net income.
ROA relates the net income to assets, while ROE relates the net income to equity.
ROE measures the return on a business’s equity.
It pits the business’s net income against its equity.
It excludes the business’s liabilities from the equation.
On the other hand, ROA measures the return on all capital sources.
That includes debt and equity.
As such, the more leveraged a business is, the higher its ROE will be compared to its ROA.
If a business is 100% financed by equity, then its ROA and ROE will be equal.
Limitations of ROA
Much like any other ratio, ROA on its own is limited on what it can inform you.
While 5% ROA is generally good enough, it will still depend on the industry that the business belongs to.
For example, a business’s ROA is 18%. Sure, 18% is already a good figure on its own.
But if the industry standard is 20%, it still falls short in terms of competitiveness.
As such, ROA is best used in conjunction with other financial ratios.
When comparing your business’s ROA to another business’s, make sure that the other business is within the same industry.
This is because different industries have different standards for ROA.
An industry where businesses are capital intensive will generally have low ROA due to the sheer volume of assets.
On the other hand, it’s much easier to generate a higher ROA the fewer assets a business has.
For example, if you compare a service-based business (which typically has few assets) to a capital-intensive one, then there would definitely be a difference.
However, since the two businesses are from different industries, the difference is to be expected and does not necessarily translate to one business being more competitive than the other.
FundsNet requires Contributors, Writers and Authors to use Primary Sources to source and cite their work. These Sources include White Papers, Government Information & Data, Original Reporting and Interviews from Industry Experts. Reputable Publishers are also sourced and cited where appropriate. Learn more about the standards we follow in producing Accurate, Unbiased and Researched Content in our editorial policy.
University of Oregon "FINANCIAL STATEMENT ANALYSIS" Page 1 . December 10, 2021
Michigan State University "Financial Ratios Part 8 of 21: Rate of Return on Assets" Page 1 . December 10, 2021
NYU Stern "Measures of Profitability " Page 1 . December 10, 2021