Perform a Two-Way ANOVA in ExcelLearn how to easily and quickly perform a two-way ANOVA in Excel
The number of things you can do with Excel is really impressive.
There’s the basic stuff of performing simple mathematical equations such as addition, subtraction, multiplication, and division.
Then, there’s the more complex stuff like finding the stand deviation, etc.
It’s no wonder why Excel is still being used by experts in highly technical fields and one such field is statistics.
Excel has a lot of tools that can facilitate statistical analysis, which can be a great help to experts or students taking lessons in statistics.
One statistical test that students usually find challenging is the ANOVA or Analysis of Variance test.
Depending on the size of the data you’re working on, performing an ANOVA on it might take too much time.
However, with the help of Excel, this time-consuming test can be done with just a few clicks here and there.
In this article, we’ll be learning how to perform a particular variant of the ANOVA, which is the two-way ANOVA, in Excel.
By the end of the article, you should easily be able to perform a two-way ANOVA in Excel whenever you need to.
What is a Two-Way ANOVA?
An ANOVA (a.k.a. analysis of variance) test helps in identifying factors that influence a particular result.
It’s generally just the first step in statistical analysis.
With the results of an ANOVA test, a researcher or test may perform further analysis on what factors affect the dataset’s variability.
With regular ANOVA (or one-way ANOVA), there’s only one independent variable.
A one-way ANOVA factors in the effects of one independent variable on a dependent variable.
On the other hand, two-way ANOVA factors in the effects of two independent variables on a dependent variable.
For example, with one-way ANOVA, you can test the effect of sunlight exposure on a plant’s growth.
Here, the independent variable is sunlight exposure while the dependent variable is the plant’s growth.
On the other hand, with two-way ANOVA, you can simultaneously test the effect of sunlight exposure and watering frequency on a plant’s growth.
Here, the independent variables are sunlight exposure and watering frequency.
With ANOVA, a researcher may be able to determine the variability of the result/outcome is due to pure chance or other factors in the analysis.
ANOVA is particularly useful in the field of economics, finance, science, social science, and medicine.
Now that we know the basics of a two-way ANOVA, let’s proceed to how we can perform it in Excel.
The Data Analysis Button
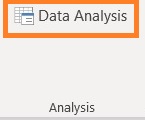
To perform a two-way ANOVA in Excel, you’ll be using this particular button:

This is the Data Analysis button which allows you to perform various statistical tests and other complex analyses, including two-way ANOVA.
To access this button, you’ll have to open the Data tab. On the very right side of the ribbon, you should see this button.

Well, that would be the case if you have loaded the Analysis ToolPak add-in.
By default, this add-in is deactivated. So if you don’t see the Data Analysis button on your Data tab, don’t fret.
You only have to load the Analysis ToolPal add-in and you should be good to go. (If you already see the Data Analysis button, you may proceed to the next section).
How to Load the Analysis ToolPak
- Click the File tab. This will bring you to the File menu.

- In the File menu, click Options. You’ll find it at the very bottom.

- In the Excel Options Menu, select Add-ins. On the right side of the window, you should find Analysis Toolpak under Inactive Application Add-ins.

- Click on Analysis Toolpak. Then, click the Go button. This will open the Add-ins dialog box.

- Tick the box next to Analysis ToolPak. Then, click the OK button.

- You have successfully added the Data Analysis button on your Data tab.

Now that you have access to the Data Analysis button, let’s learn how to perform a two-way ANOVA in Excel.
How to Perform a Two-Way ANOVA in Excel
To perform a two-way ANOVA, we first need data.
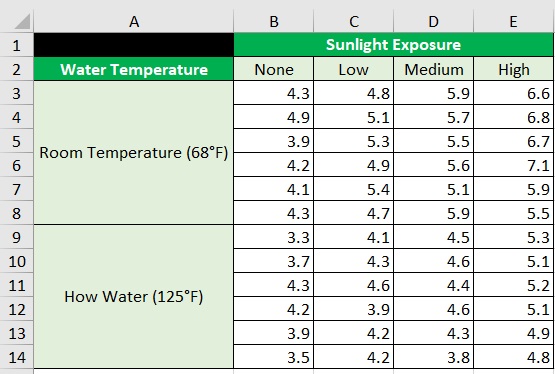
As such, we’ll be using the following dataset for illustration:

For their science project, a group of students wants to find out if water temperature (room temperature vs hot temperature) and sunlight exposure affect a plant’s growth.
They planted 48 seeds to test their hypothesis. They let the seeds grow for two months under different conditions of sunlight exposure and water temperature.
After three months, the group of students measures the height of each plant (in inches). The above table is the result of their experiment.
From the table above, we can see that six plants were grown under each condition.
Remember this as we’ll be needing it when we perform our two-way ANOVA test.
Perform a Two-Way ANOVA in Excel
- Open the Data tab. On the very right side of the ribbon, we should see the Data Analysis button. Click it. This will open the Data Analysis menu which allows us to perform various complex analyses (including two-way ANOVA) in Excel.

- In the Data Analysis menu, select Anova: Two-Factor with Replication. Then, click the OK button. We choose this option because there are multiple observations in each group.

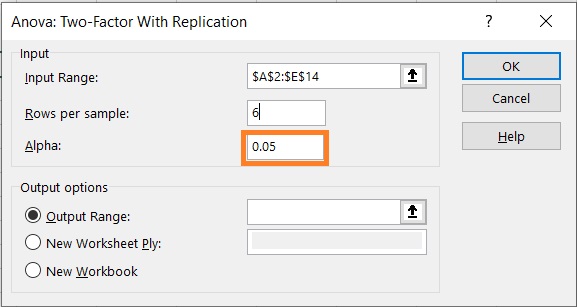
- A pop-up menu should appear. This is where we’ll set the parameters of the two-way ANOVA. Click on the text box next to “Input Range”. Then, select the cells that contain the data that we’re working on.

- Next, in the textbox next to “Rows per sample”, enter the number of samples or observations per group. We’ll be inputting 6 here as six plants were grown under each condition.

- Alpha refers to the significance level. The default value here is 0.05. We’ll leave it as it is.

- Lastly, we have to choose where the result of the two-way ANOVA will show. For now, we want to appear in the same sheet as the data we’ve used for the test. As such, we will choose the Output Range option. Then, click on the textbox next to it. Select the first cell where the results will appear (we’ll choose cell G1).

- Click the OK button. We have successfully performed a two-way ANOVA in Excel.

Interpreting the Results
Let’s take a look at the results:

- There are four tables. The first three tables will show us summary statistics for each group/condition (count, sum, average, and variance).
- As the level of sunlight exposure increases, the average plant growth also increases.
- The average plant growth for those watered with room temperature water is consistently higher than for those watered with hot water.
- The fourth table shows us the result of the ANOVA.
- The p-value for the interaction between sunlight exposure and water temperature is 0.011538026, which is insignificant at an alpha level of 0.05. This means that the effect of sunlight exposure is consistent across each level of water temperature (and vice versa).
- The p-value for sunlight exposure (columns) is 53168686524041E-13, which is significant at an alpha level of 0.05. This means that sunlight exposure does affect plant growth.
- The p-value for water temperature (sample) is 44467304041737E-12, which is significant at an alpha level of 0.05. This means that water temperature does affect plant growth.
Conclusion
And that is how you perform a two-way ANOVA in Excel.
I hope that you’re able to use your learnings here in your future endeavors.
