Finding Outliers in ExcelAnd what to do with them


Once in a while (or maybe more often), you may come across a dataset that contains values that are far above or below the average or given range.
For example, let’s say you have the following group of values: 1, 3, 9, 6, 7, 1000.
Notice anything odd about it? If you say that 1000 seems out of place, you’re right.
The other values in the group are closer to each other compared to 1000. This is what we refer to as an outlier.
Outliers are values that are far above or below the dataset’s range, average, or median.
In statistics, outliers are often removed from the equation because they don’t represent the group or population.
If they are included in calculations, they can greatly skew the results. Just imagine a bus that has 20 passengers, all of which are your typical salaryman.
Each salaryman earns about $4,800 monthly.
In comes a wealthy businessman who earns about $1 million monthly.
If we calculate the average income of all 21 passengers, do you think the result would truly represent the average income of each passenger? I’d say not.
This is why it’s important to find any outliers in the dataset that you’re working on.
You’d want to find and remove them from the equation so that they don’t positively or negatively skew the results.
In this article, I’ll be showing you various methods you can use to find outliers in Excel.
We’ll start with a simple yet effective method (sorting). From there, we’ll go through the more scientific methods of identifying outliers.
Let’s get started.
Sort Data to Find Outliers
Let’s start with a simple yet effective method of finding outliers: sorting the data (from largest to smallest or vice versa).
It’s quick and easy to perform. The idea is that you sort your data and then manually go through the top and bottom values to see if they are within the range of the dataset.
If not, they’re probably outliers and should be removed from the equation.
The tradeoff about this quick and easy method is that it’s only really effective for small datasets.
For large datasets, you might want to use methods that involve statistical equations.
Anyway, to show you how this method works, here’s a sample dataset:

This dataset has 25 values. Let’s sort it from largest to smallest to find any outliers.
How to Find Outliers
- First, select the entire dataset (you can choose to not include the column header).

- Open the Home tab. On the right side of the ribbon, you should see the Sort & Filter button. Click on it.

- Select “Sort Largest to Smallest” from among the options.

- With the data now sorted, you can now find outliers (if there are any).

- If you notice the topmost and bottommost values, you’ll see that they are far above or below the range of the group, which is within 20 to 60. As such, these two values are your outliers.

- You have successfully found the outliers within your data. You can proceed to remove them from the equation. Or you may replace them with other observations/values that are close to the dataset’s range.
Use the Dataset’s Inter-Quartile Range (IQR) to Find Outliers
Let’s proceed to one of the scientific methods of finding outliers. In this method, we’ll be using the Inter-Quartile Range (IQR).
The IQR describes the middle 50% of values of the dataset (when ordered from lowest to highest).
In other words, the IQR defines where the beginning and end of the bulk of the dataset’s values lie. It’s important that the values must be arranged from lowest to highest.
To calculate a dataset’s IQR, we need to subtract its quartile 1 (Q1) from its quartile 3. Put into formula form, it should look like this:
IQR = Q3 – Q1
In Excel, there’s an easy way to calculate a dataset’s quartiles.
And that’s with the QUARTILE.INC function. With this function, we can calculate a dataset’s specific quartile.
The formula to use the QUARTILE.INC function is as follows:
=QUARTILE.INC(array,quartile)
Where
array – refers to the range of cells that contains the values from which you want to calculate the quartile
quartile – this specifies which quartile you want to calculate. Setting it to 1 to calculate quartile 1, 2 to calculate quartile 2, 3 to calculate quartile 3, and 4 to calculate quartile 4
To show you how the method works, let’s use this dataset:

How to Find the Outliers
- Let’s first calculate the dataset’s quartile 1 (Q1). To do so, we’ll be using the formula =QUARTILE.INC(A2:A26,1). Let’s enter this formula in cell E2.

- Next, let’s calculate the dataset’s quartile 3 (Q3). To do so, we’ll be using the formula =QUARTILE.INC(A2:A26,3). Let’s enter this formula in cell E3.

- Now that we have our Q1 and Q3, we can calculate the dataset’s IQR. To do so, we’ll be using the formula =E3-E2, which are the cells that contain the Q3 and Q1 values. Let’s enter this formula in cell E4.

- Let’s calculate the dataset’s lower bound (Q1 – (IQRx1.5)). The lower bound defines which values are outliers and which are not. Any value that is below the lower bound is an outlier. To calculate the lower bound, we’ll use the formula =E2-(1.5*E4). Let’s enter this formula in cell E5.

- Let’s calculate the dataset’s upper bound (Q3 + (IQRx1.5)). The upper bound also defines which values are outliers and which are not. Any value that is above the upper bound is an outlier. To calculate the lower bound, we’ll use the formula =E3+(1.5*E4). Let’s enter this formula in cell E6.

- We now have the necessary data to find outliers. Any value that is below 37 or above 165 is an outlier. We may manually check each value that meets these conditions, or we can use the OR function as follows:

- The OR function will return TRUE if the value is an outlier. Otherwise, it will return FALSE. Copy-paste the formula to the rest of the column.
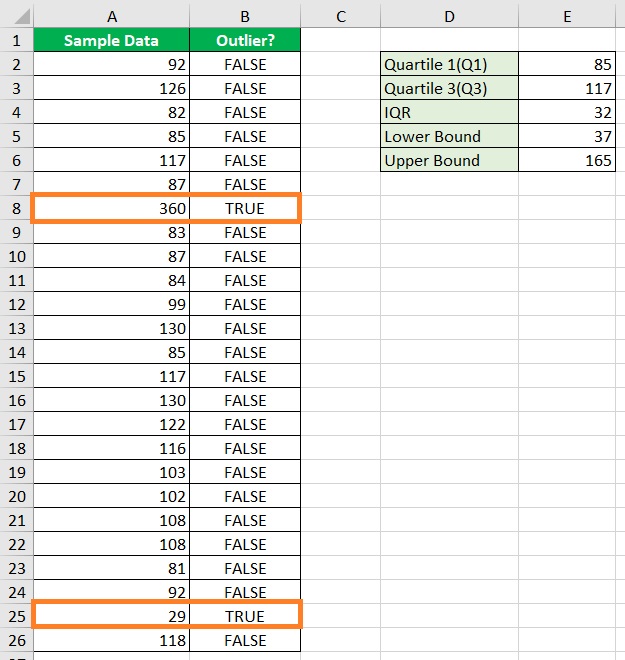
- The dataset has two outliers: 29, and 360. With that, we have successfully found the dataset’s outliers
Use the Dataset’s Mean and Standard Deviation to Find Outliers
Another method we can use to find outliers involves using the dataset’s mean and standard deviation.
A dataset’s mean is its average value. Meanwhile, the standard deviation describes how much the points in a distribution differ or stray from the dataset’s average value (mean).
Any value that is 2 or 3 standard deviations away from the mean is usually considered an outlier.
In Excel, there are functions we can use to calculate a dataset’s mean and standard deviation.
To calculate the mean, we use this formula:
=AVERAGE(array)
or
=AVERAGE(number1,number2,number3…)
Where
array – refers to the range of cells that contains the values from which you want to calculate the mean
To calculate the standard deviation, we use this formula:
=STDEV.S(array)
or
=STDEV.S(number1,number2,number3…)
Where
array – refers to the range of cells that contains the values from which you want to calculate the standard deviation
(Note that you can also use the STDEV.P function if the dataset you’re working on is the population)
We’ll be using these values to calculate a dataset’s lower and upper bounds. To show how the method works, we’ll be using this dataset:

How to Find the Outliers
- Let’s first calculate the dataset’s mean. To do so, we’ll be using the formula =AVERAGE(A2:A26). Let’s enter this formula in cell E2.

- Next, let’s calculate the standard deviation. To do so, we’ll be using the formula =STDEV.S(A2:A26). Let’s enter this formula in cell E3.

- Let’s calculate the dataset’s lower bound (Mean – (Std. Deviation x 2)). The lower bound defines which values are outliers and which are not. Any value that is below the lower bound is an outlier. To calculate the lower bound, we’ll use the formula =E2-(2*E3). Let’s enter this formula in cell E4.

- Let’s calculate the dataset’s upper bound (Mean – (Std. Deviation x 2)). The upper bound also defines which values are outliers and which are not. Any value that is above the upper bound is an outlier. To calculate the lower bound, we’ll use the formula =E2+(2*E3). Let’s enter this formula in cell E5.

- We now have the data required to find outliers. Let’s use the OR function to identify which values are outliers and which ones are not:

- The OR function will return TRUE if the value is an outlier. Otherwise, it will return FALSE. Copy-paste the formula to the rest of the column.

- We have successfully found two outliers: -102, and 360.
Conclusion
After finding the outliers, what are you supposed to do with them?
The best answer to this question is to remove them from the equation.
There are two ways you can go with this: (1) remove the outlier from the dataset; (2) modify them so that they are within the reasonable range (normalizing the outliers).
In this article, we were able to discuss the different ways to find outliers in Excel.
Which method did you prefer the most?
Let me know in the comments.