How to Make a Data Table in ExcelLearn how to use one (1) variable and two (2) variable data tables in Excel
In data analysis, you often may have to create different scenarios with different inputs to come up with different outputs.
For example, you may be planning different scenarios for producing a particular product with different raw material compositions.
One scenario may have a 70% – 30% mix, while another may have an 85%-15% mix. Creating these many scenarios can be time-consuming.
Fortunately, Excel has a feature that can quickly create scenarios for you instead of manually creating them.
What I’m referring to is the Data Table feature, which allows you to create… data tables!
They’re especially useful if you’re using a formula that depends on several values (and you want to test it with different input combinations).
Rather than manually modifying the formula to test all the combinations of inputs, the data table will do it for you.
Currently, Excel only allows the creation of one (1) variable and two (2) variable data tables.
This limit only pertains to the number of input cells, thankfully.
There’s no limit to the number of scenarios you can create with a Data table. Hopefully, in the future, the Excel development team can improve this feature to allow more input cells.
In this article, I’ll be showing you how to create a Data Table in Excel and what you could do with it.
Knowing how to create a Data Table in Excel can help you greatly in your What-If analysis on any dataset that requires it.
Let’s get started.
Create a One-Variable Data Table in Excel
A one-variable data table allows the testing of a series of values for a single input cell.
The data table will then show how these values affect the result of the formula used.
For example, you can use a one-variable data table to show how different interest rates affect the future value of an investment.
It’ll be easier to explain what a one-variable data table does with an illustration.
So here’s one:

This a table that calculates the future value of an investment:
- Cell B2 contains the amount of the initial investment
- In cell B3, you’ll find the annual interest of the investment
- Cell B4 contains the number of the compounding period
- Cell B5 contains the period (in years) of the investment
- Finally, cell B7 contains the future value of the investment. To calculate this value, this formula is used:
![]()
What would the future value of the investment be if it earns a different annual interest rate? To find out, we’ll be using a one-variable data table.
How to Create a One-Variable Data Table
- Let’s set up the area where the data table will be made. We can choose to have the table be column-oriented or row-oriented. For now, let’s create a column-oriented table. Here’s how the column header of the data table will look like:
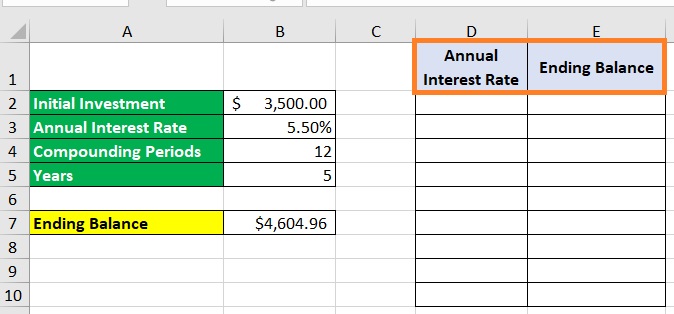
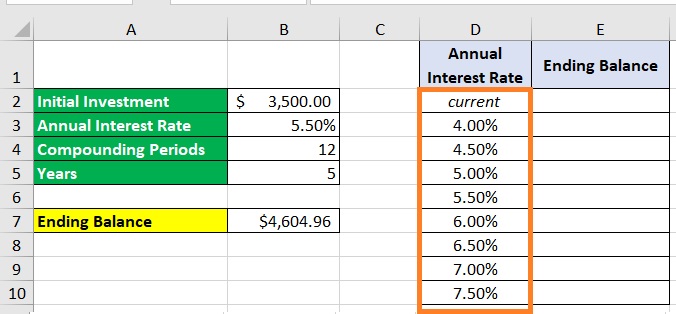
- In the “Annual Interest Rate” column enter the different interest rates that you want to test. Just have the first empty cell contain the value “current”. This is so that the data table that we’ll be creating has a basis for its calculations.
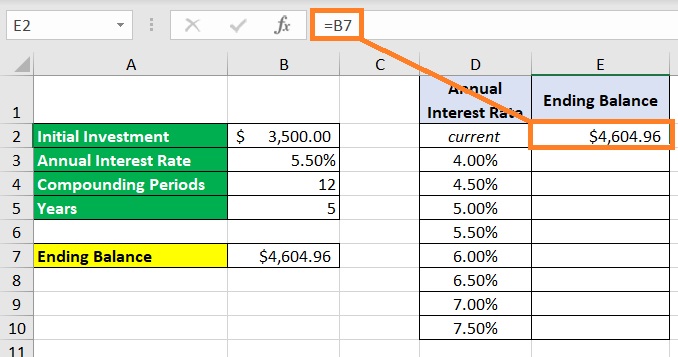
- In the “Ending Balance” column, make a reference to the cell that contains the formula in the first empty cell. In our illustration, this will be cell B7. Leave the other cells of the column empty as the data table will fill them in for you.
- Select the two columns (don’t include the column headers).

- We’re ready to create the data table. Open the Data tab. On the right side of the ribbon, you should see the What-if Analysis button. Click it.

- Among the options that show, select Data Table.

- This will open the Data Table dialog box. This is where will enter the input cell. Since we’re making a column-oriented data table, we’ll be filling in the Column input cell. Refer to the cell that contains the current variable (in our illustration, this will be cell B3). Press the OK button after doing so.

- We have successfully created a one-variable data table. It should now should the different future values with the different annual interest rates. Format the table as you see fit.
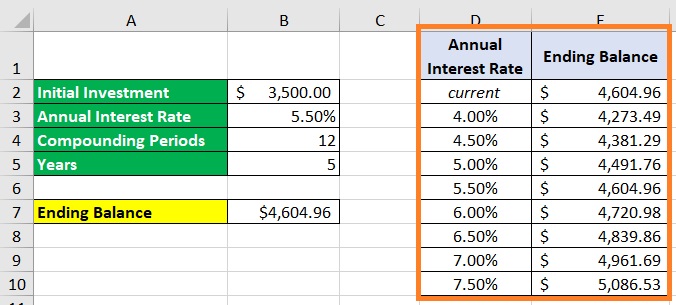
(You may also have the data table be row-oriented. To do so, enter the input cell in the Row input cell textbox instead of the Column input cell textbox. You can also test multiple formulas with a one-variable data table. Just add another row or column and make a reference to the cell that contains the formula. Do this for every additional formula that you want to test).
Create a Two-Variable Data Table in Excel
A two-variable data table allows the testing of a series of values for a combination of two input cells.
The data table will then show how these combinations of values affect the result of the formula used.
For example, you can use a two-variable data table to show how different interest rates and periods (in years) affect the future value of an investment.
To illustrate, let’s use the same table we used in our one-variable data table example:

Let’s see how a change in the annual interest rate and period (in years) affects the future value of the investment. To do so, we’ll create a two-variable data table.
How to Create a Two-Variable Data Table in Excel
- Let’s set up the area where the data table will be made. Since we’re using two input cells, we’ll be using one set of rows for one input cell and a set of columns for the other. In our illustration, we’ll be using the first empty column to enter the different annual interest rates. Then, we’ll use the first empty row to enter the different periods (in years):

- Enter the different variables in their respective areas (annual interest rates in the first empty column, and periods in the first empty row):

- In the first empty cell of the table we created, make a reference to the cell that contains the formula. In our illustration, this will be cell B7.

- Select the data table range (not including the row and column headers).

- We are now ready to create our data table. Open the Data tab. On the right side of the ribbon, you should see the What-if Analysis button. Click it.

- Among the options that show, select Data Table.

- This will open the Data Table dialog box. Since we’re making a two-variable data table, we’ll be filling in both the Row input cell and Column input cell textboxes. For the Row input cell, enter the cell that relates to the row variables (cell B5 in our illustration). For the Column input cell, enter the cell that relates to the column variables (cell b3 in our illustration). Press the OK button after doing so.
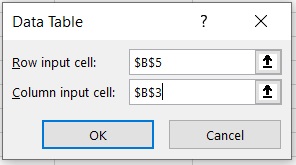
- We have successfully created our two-variable data table. It should now show the different future values based on the different combinations of annual interest rates and periods. (Format the table as you see fit).

Conclusion
And that’s how you create a one-variable or two-variable data table in Excel.
Did you see how handy a data table is in performing a what-if analysis?
Let me know your thoughts on this Excel feature in the comments.
