Calculate Confidence Interval in ExcelUnderstand how you can calculate a confidence interval in Excel
Excel is such a wonderful tool. You can use it to simply contain a dataset.
You can also use it for letter templates (if Word does not do it for you).
But more importantly, you can use Excel to perform mathematical or scientific calculations.
You can even use it to perform statistical analysis. This can be done through formulae or Excel functions.
One of the statistical variables you can calculate in Excel is the confidence interval.
Aside from calculating the confidence interval itself, you can also use Excel to calculate the other variables that you’ll need such as the mean and standard deviation.
But you can only calculate a confidence interval in Excel if you know how to calculate it. Don’t worry.
In this article, I’ll not only be showing you how to calculate a confidence interval in Excel, but I will also be sharing information about what confidence is.
By the end of this article, you should be to properly calculate confidence intervals in Excel.
First, let’s get to know what a confidence interval is.
What is a Confidence Interval?
In statistics, a confidence interval refers to the probability that a range of values will include a population parameter.
It’s another way to describe probability. It is often shown as the mean of an estimate plus and minus the variation in such an estimate.
For example, let’s say that the mean is 65 and the value of variation is 7.2, the confidence interval will be 65 ± 7.2 (or 57.8 to 72.2).
This is the range of values that an estimate will fall between when doing repeated tests (within a certain level of confidence).
To calculate the variation, you will need to gather the significance level, standard deviation, and size of the population.
To calculate the mean, you will need to get the average value of the sample or population.
If you have these two variables, you will be able to calculate the confidence interval.
A confidence interval is often calculated to make statistical estimates such as:
- Population means
- Variation estimates among groups
- Proportions
- Differences between population means
What You’ll Need to Calculate Confidence Interval in Excel
To calculate a confidence interval in Excel, you need to have the following:
- A set of numeric values (identify whether it is the sample size or the entire population)
- The mean (or average) of the set of values. You can calculate this in Excel using the AVERAGE function
- The standard deviation of the set of values. You can calculate this in Excel using the STDEV.P function (if the set of values is the entire population) or the STDEV.S function (if the set of values is a sample)
- Significance level (or alpha value). This should be a value between 0 and 1. It can be calculated by subtracting the confidence level from 1. The most commonly used value for this is 0.05 (or 5%).
- Sample size (if the set of values is a sample) or population size (if the set of values is the entire population)
- The value of variation. You can calculate this in Excel using the CONFIDENCE function.
The AVERAGE Function
The average function calculates the average value (or mean) of a selected data range (or set of numerical values).
You can use it by using the formula:
=AVERAGE(range)
Where:
range – can be a set or range of cells, a set of numbers, or a combination of both.
For example, if you want to calculate the average of the values in cells A1 to A12, the formula will be =AVERAGE(A1:12)
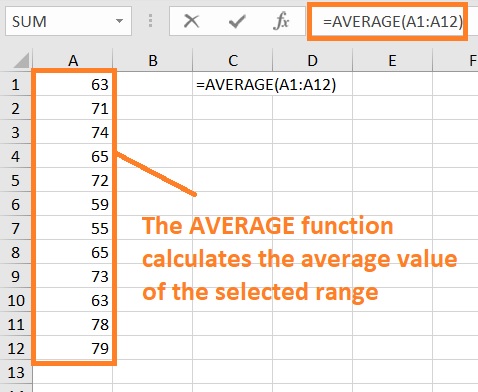
Note that the AVERAGE function ignores cells that have non-numeric values in them.
If the range only has non-numerical values in them, the AVERAGE function will return a #DIV/0! Error.
The STDEV.P or STDEV.S Function
The STDEV.P or STDEV.S function calculates the standard deviation of a selected data range (or set of numerical values).
Use the STDEV.P function if the data range is the entire population.
Use the STDEV.S function if the data range is a sample.
You can use either of these functions by using the formula:
=STDEV.P(range)
-or-
=STDEV.S(range)
Where:
range – can be a set or range of cells, a set of numbers, or a combination of both.

Same with the AVERAGE function, the STDEV.P or STDEV.S function ignores cells that have non-numeric values in them.
The CONFIDENCE Function
The CONFIDENCE function calculates the value of variation (or confidence value), which is important in calculating a confidence interval.
This value is one of the factors that determines the lower and upper limits of the confidence interval. You can use it by using the formula:
=CONFIDENCE(alpha,standard deviation,size)
Where:
alpha – refers to the significance level. It is presented as a decimal and has a value between 0 and 1.
standard deviation – refers to the standard deviation of the selected range of data
size – refer to the size of the sample or population
Note that newer versions of Excel have variations for this function. CONFIDENCE.NORM is a variation that returns the confidence value using a normal distribution.
CONFIDENCE.T is a variation that returns the confidence value using a T distribution.
Calculate Confidence Interval in Excel
Now that we are familiar with what we need to calculate a confidence interval, let’s finally learn how we can do it in Excel.
First, we’ll need a dataset that we’ll use the formula on. For illustration, we’ll be using the following dataset:
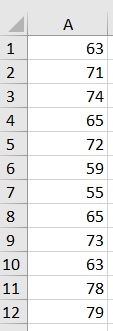
Then we’ll need to determine the significance level and population (or sample) size. Assuming that we’re working on an entire population of data, the population size is 12.
We’ll also set the significance level at 5% or 0.05. For easier use of the CONFIDENCE function later, we’ll arrange the variable as follows:
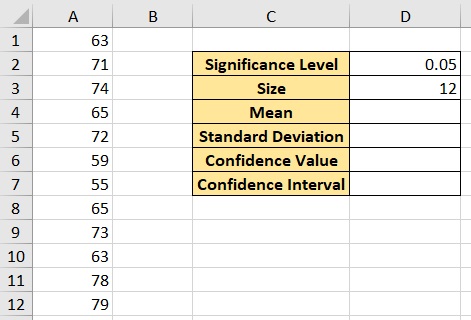
Let’s get on with it.
How to Calculate Confidence Interval in Excel
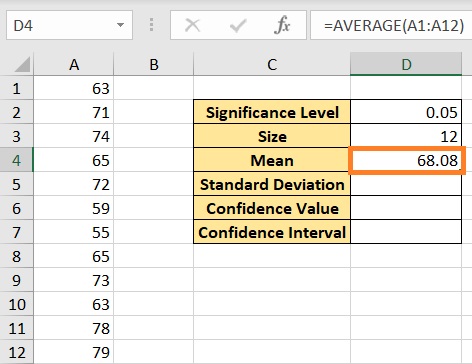
- Calculate the true mean. This can be done by using the AVERAGE function. Select the cell where you want to show the result (we’ll use cell D4 for illustration). Enter the formula =AVERAGE(A1:A12) (this will calculate the mean of the selected range). Press the Enter key after doing so.
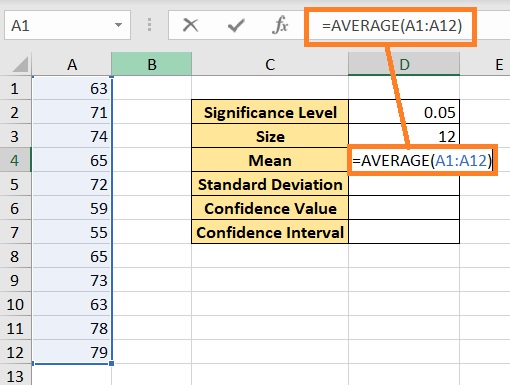
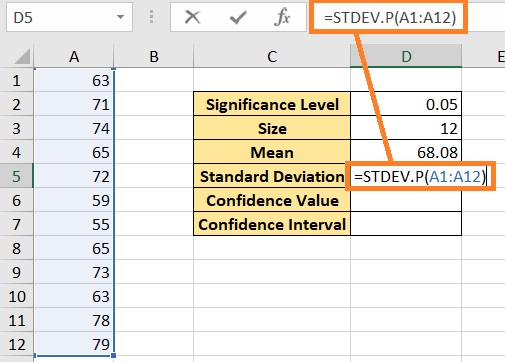
- Calculate the standard deviation of the selected range. This can be done by using the STDEV.P function. . Select the cell where you want to show the result (we’ll use cell D5 for illustration). Enter the formula =STDEV.P(A1:12). Press the Enter key after doing so.
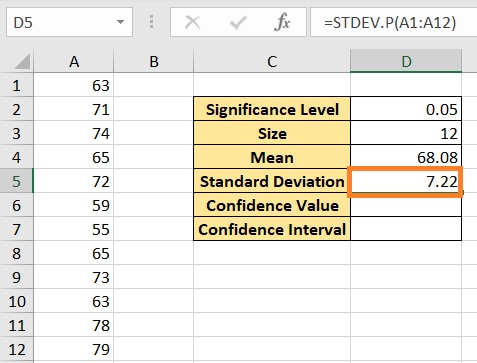
- Calculate the value of variation (or confidence value). This can be done by using the CONFIDENCE function. . Select the cell where you want to show the result (we’ll use cell D6 for illustration). Enter the formula =CONFIDENCE(D2,D5,D3). Press the Enter key after doing so. (Note that to calculate this value, you’ll need the significance level (cell D2), standard deviation (cell D5), and size (cell D3)).


- Finally, we can calculate the confidence interval. This can be done by adding the confidence value to the mean to determine the upper limit and subtracting the confidence value from the mean to determine the lower limit. The lower limit is 64, while the upper limit is 72.17.

Things to Keep in Mind When Calculating Confidence Interval in Excel
- Be sure to have no blank cells in your range selection. In the calculation of mean and standard deviation, black cells will be considered to have a value of zero. This will distort the calculation of these variables.
- The significance level should be a value between 0 and 1. If it is outside of these values, the CONFIDENCE function will return a #NUM!
- The standard deviation must have a value greater than zero. If not, the CONFIDENCE function will return a #NUM!
- The size must be greater than 1. If not, the CONFIDENCE function will return a #NUM!
Conclusion
And that’s it for this article. We familiarized ourselves with what the confidence interval is and how we can calculate it in Excel.
You should be able to properly calculate the confidence interval in Excel now.
