Break-even AnalysisDefined with Formula & More


You woke up one day to an idea so good that it makes you want to start a business.
You think of ways to market your idea. “I’m gonna make a fortune out of this!”, you think to yourself.
But, let me stop you for now.
Let’s be grounded for a little bit.
Starting a business without careful consideration can be a recipe for disaster.
Start-up businesses fail not because they spurred out of a terrible idea.
In fact, most start-ups have good ideas and there’s a reason why investors fund them.
Rather, these start-up businesses fail because of a lack of proper planning.
Running a business entails costs and failure to account for these costs can be detrimental to the business.
At the very least, what you earn from the business should be enough to cover the cost of running it.
This not only applies to starting a business but also to launching a new product, opening up a new branch, or hiring additional employees.
Sure, these actions could potentially rake in more revenue for your business, but they do have costs that you need to account for.
Thankfully, we have many tools at our disposal that can help with financial decisions.
One of them is the “break-even analysis.”
What break-even analysis does is that it allows you to assess whether or not a new business idea is profitable.
And if it is, at what point does it become profitable?
A break-even analysis will help you assess whether it is worth pursuing a new business, a new project, a new branch, etc.
And at its core is the so-called break-even point. It is the point where the revenue equals the cost.
This means that anything beyond the break-even point is a potential for profit.
What is break-even analysis?
A break-even analysis is a financial calculation that compares the cost of an action to its potential revenue.
It does this to determine the point where the action generates neither a profit nor loss, which is what we refer to as the break-even point.
For example, you’re planning to launch a new product.
With break-even analysis, you can assess how many units of that product must be sold to cover its costs.
At that point, you won’t be losing money (though you won’t be making money either).
If you’re able to sell more units of this new product beyond its break-even point, that’s the time when you’ll make a profit out of it.
Investors use break-even analysis when deciding to invest in a particular stock too.
For example, let’s say that a stock consistently receives annual dividends.
An investor can use break-even analysis to compare the returns they get from the stock to its price.
They can then gauge how long they will be able to fully recover the cost of the stock – it could be a year, 5 years, or 10 years.
The investor can then consider this as one of the factors on whether the stock is worth investing in.
Break-even analysis can also be used anytime a business considers an action that adds cost.
For example, a business is planning to hire additional employees.
Hiring employees comes with a cost.
But hiring additional employees can potentially increase revenue.
This is where the business uses break-even analysis.
With break-even analysis, it can gauge by how much revenue must increase to make hiring additional employees worth it.
The increase in revenue must be enough to cover the additional cost of hiring new employees.
But it’ll be even better if the increase in revenue exceeds the additional cost.
How does break-even analysis work?
Break-even analysis is mostly an internal management tool.
Businesses don’t normally present it to external parties (e.g. potential investors , regulatory bodies).
That said, some creditors, such as banks, can ask businesses to provide a break-even analysis.
It will serve as part of the business’s financial projections, which will then be considered when deciding to extend credit or not.
Break-even analysis considers three variables in its computation: the variable cost, fixed cost, and revenue (e.g. sales price per unit, return on investment, etc.).
Fixed costs are expenses that generally remain the same no matter the level of activity is.
For example, the cost of renting space normally does not increase or decrease no matter how many units of a product are sold or produced.
Another example, the salaries of employees don’t increase or decrease with changes in the level of sales or production (unless it’s stated in the contract).
On the other hand, variable costs are expenses that change depending on the level of activity.
For example, sales commission varies depending on the level of sales.
When sales increase, the cost of sales commission increases too.
Conversely, when sales decrease, the cost of sales commission decreases too.
Break-even analysis usually presents variable costs on a per-unit basis.
For example, the cost of direct material per unit of product produced.
Revenue refers to the return you generate for doing a certain action.
For example, when you successfully sell a product, you generate sales revenue.
When you successfully perform a service, you generate service revenue.
Break-even analysis works by comparing the contribution margin to the total fixed costs.
Contribution margin is the difference between revenue and variable cost.
From there, we can either compute the number of units or the level of revenue required to fully cover variable and fixed costs.
Break-even point formula
There are two ways to compute the break-even point, both of which are valid.
The first way is to compute the break-even point in units. It uses the following formula:
The break-even point is calculated by dividing your fixed costs by the difference between your revenue per unit and your variable cost per unit, using the formula: Break-even point = Fixed Cost ÷ (Revenue per unit – Variable Cost per unit).
To illustrate, let’s say that a business is planning to launch a new product.
The new product is expected to have a variable cost of $2 per unit.
Producing it would increase the total fixed cost by $30,000.
The business is confident that it can sell the new product for $10 per unit. Let’s compute the break-even point for the new product:
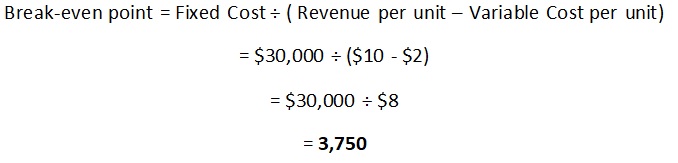
The business has to sell 3,750 units of the new product for it to break even.
If the business sells more than that, it will make a profit.
However, if it sells less, it will incur losses.
The other way is to compute the level of revenue required to reach the break-even point.
This can be done by using the formula:
Break-even point = Fixed Cost ÷ Contribution Margin
Where:
Contribution Margin = (Revenue per unit – Variable cost per unit) ÷ Revenue per unit
Let’s compute for the break-even point again from the above illustration, only this time, we will be using the second formula.
First, we must compute the contribution margin:
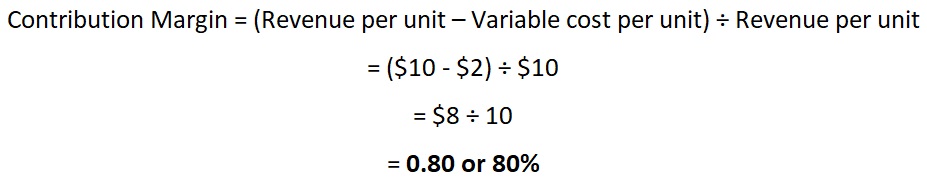
Now that we have the contribution margin, we can compute the break-even point:
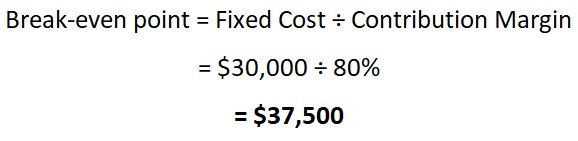
The business will have to generate $37,500 of sales revenue from the new product for it to break even.
The fixed cost greatly influences the break-even point.
The lower it is, the lower the break-even point will be.
If there is no fixed cost, then any level of activity will generate a profit, provided that revenue is greater than variable costs.

Why do a break-even analysis?
A break-even analysis does not take much of your resources, provided that the relevant data are readily available.
In fact, it is encouraged that a break-even analysis is performed whenever a decision causes an increase in costs.
Here are more of the benefits that a break-even analysis can provide you:
Better pricing
While pricing can be done by comparing the prices of similar products from your competitors, that isn’t always the best for your business.
Rather, it’s better to consult your break-even point for pricing.
The more you know the relationship between cost and revenue, the more you’ll be able to price better.
Ask yourself this, “If I charge this much for this product, will I be able to recover its costs?
Will I be able to make a profit?”.
If your answer is no to either of these questions, then you might need to reconsider your pricing decision.
There’s no point in selling a product if you can’t make a profit out of it.
At the very least, you must be able to break even.
Cover cost, including fixed cost
It’s easy to forget fixed costs when deciding on a price.
For one, they usually are not computed on a per-unit basis.
So it’s not like pricing would be able to influence them… right?
Well, it should be the other way around.
Fixed costs should influence pricing, not just variable costs.
The revenue you get from selling a product must be able to cover both variable and fixed costs.
And that’s where break-even analysis comes in.
With a break-even analysis, you’ll be able to understand why fixed costs must also be considered in pricing decisions.
Set revenue targets
Now that you know your break-even point, you can use that as a reference for the level of sales you must attain to reach a certain amount of profit.
Having profit and cost represented in numbers is a plus too.
It’s easier to set your sales goals when you know how much is needed to at least break even.
Plus, it’s easier to follow through with a sales goal if you already have a clear number in mind.
Decide with numbers, not just emotions
Let’s face it.
Running a business comes with costs.
Meaning that you generally need money to continue operating a business.
A business does not run on emotion or ideas alone (though it would be interesting if that’s the case).
Sure, having a passion for your business will more than likely lead to its success.
But passion alone does not sustain a business.
You need to think about numbers too.
With a break-even analysis, you’ll have the data you need to assess whether a business idea is worth pursuing or not.
The limitation of break-even analysis
When doing break-even analysis, you must note that it does not consider market demand.
It only considers the number of units or level of revenue required to break even.
Sure, it’s great to know that you’ll need to sell at least 1,000 units of product for you to break even.
But that does not tell you that you can reliably sell 1,000 units of such a product.
For that, you’ll need to research the demand for such a product and then employ marketing strategies to capture that demand.
Still, knowing how many units of a product you need to sell to not incur losses is already beneficial.
With it, you can decide how much time and effort you’ll need to exert to exceed the break-even point.
You can also use it to decide whether a project or a product is worth continuing or pursuing.
If a producing and selling product requires too much time and effort, you can decide to pursue selling another product instead.
FundsNet requires Contributors, Writers and Authors to use Primary Sources to source and cite their work. These Sources include White Papers, Government Information & Data, Original Reporting and Interviews from Industry Experts. Reputable Publishers are also sourced and cited where appropriate. Learn more about the standards we follow in producing Accurate, Unbiased and Researched Content in our editorial policy.
University of Baltimore " Break-Even Analysis and Forecasting" Page 1 . January 17, 2022
Alamo Colleges District "Contribution Margin, Break-Even Analysis" White Paper. January 17, 2022
University of Kentucky " Break-even analysis " Page 1 . January 17, 2022