RegressionDefined along with Formula & How to Calculate


Regression is a statistical technique that is used to estimate the relationship between a dependent variable, typically Y, and one or more independent variables.
Linear regression, also known as ordinary least squares or simple regression, is the most common form of regression analysis.
This form of regression shows the relationship that exists between two different variables derived through the line of best fit.
Linear regression is displayed graphically by graphing a line that has a slope that defines the way in which one variable affects another variable.
The y-intercept is where the line crosses the y-axis and is the constant term in linear regression analysis.
There are non-linear regression models, but they tend to be more complicated.
Regression analysis is a tool that can be used to discover the relationship that exists between variables in observed data.
However, it does not easily provide a cause for the relationship. Regression analysis is used for a variety of purposes in economics, finance, and business.
Essential Points
- Regression is a statistical method that can be used to help analyze the relationship that exists between two or more variables.
- A regression model can be used to indicate if the changes seen in a dependent variable are related to the changes occurring in one or more of the explanatory variables. This is done by finding the line of best fit and observing the way in which the data is distributed about the line.
- Regression analysis is useful in economics, finance, and business for making decisions and analyzing failures, among others.
Regression Explained
Regression is a statistical process that is used to identify the variables that affect another variable and ascertain the extent and character of the relationship between the variables.
There are two primary methods of regression.
These are simple linear regression and multiple linear regression.
However, in addition to these two methods, there are non-linear regression methods that can be used in more complicated situations.
The Assumptions for Linear Regression Models
Regression analysis is a useful tool for understanding the relationship between two variables.
But, there are four assumptions that need to be made when using linear regression.
- There is a linear relationship between the independent and dependent variables.
- There is a normal distribution of the variables.
- The explanatory variables are independent of each other.
- Homoscedasticity: The error terms have constant variance.
Regression and Econometrics
Econometrics is a part of economics in which mathematical and statistical methods are used to evaluate economic data.
It can be used to predict trends which can help businesses plan for the future.
Econometrics can also be used to estimate economic relationships, which can be useful when making operational or financial decisions.
When using econometrics, an economist must define the independent and dependent variables and develop a theory to explain the relationship between the variables.
Then, a statistical model is selected to examine the relationship between the variables.
This is often multiple linear regression.
Econometrics has been criticized for being overly dependent on the evaluation of regression outputs without associating them with an economic theory or trying to find a causal mechanism.
It is vital that anything found in the data can be explained by a theory, even if it requires developing a new theory.
Computing Regression
The least-squares approach is frequently used in linear regression models to find the line of best fit.
It does this by minimizing the sum of the squared errors.
The squares are calculated by squaring the distance from the mean value of the data set or regression line to the data point.
After this is done, a regression model is created.
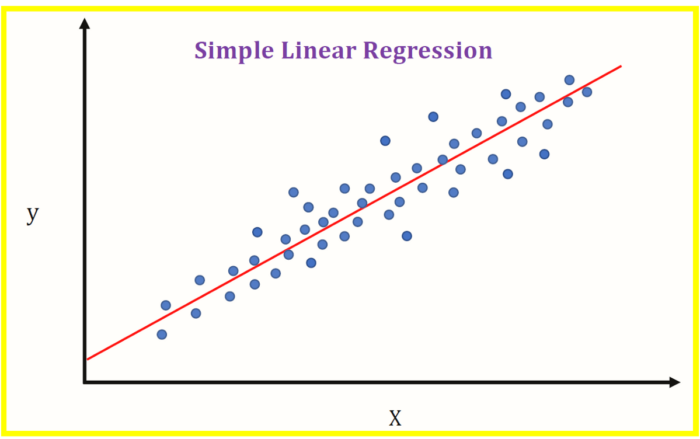
Simple Linear Regression
With simple linear regression, you will find the correlation between one independent variable and a corresponding dependent variable.
You can express this relationship as a straight line.
Here is the equation.
Y = a + bX + u
Where:
Y= dependent variable you are trying to explain
X = independent variable you are trying to associate with y
a = y-intercept
b = slope of the explanatory variables
u = error term
Simple linear regression can be used in a number of ways by businesses.
One example would be to use this analysis to look at the effect of the product price on product sales.
Multiple Linear Regression
Multiple linear regression is used to determine the correlation between 2 or more independent variables and the corresponding dependent variable.
These independent variables may be categorical or continuous.
Here is the equation for multiple linear regression.
Y = a + b1X1 + b2X2 + b3X3 + … bt Xt + u
Where:
Y= dependent variable you are trying to explain
X = independent variable you are trying to associate with y
A = y-intercept
b = slope of the explanatory variables
u = error term
This method of regression is useful for forecasting the effects of a change a business may want to make.
It can also be used to predict trends or get point estimates.
Additionally, regression can be used to predict the sales for a business based on GDP growth, prior sales, or other conditions.
Another regression model that is frequently used in finance is the capital asset pricing model (CAPM).
It is used to find the costs of capital and for pricing assets.
Example of Regression Analysis in Finance

Regression is frequently used in finance to establish the number of factors, such as interest rates, price of commodities, or specific industries, among others, that affect the change in the price of a particular asset.
Often, the capital asset pricing model (CAPM), which is based on regression, is used to predict stock returns and to find the costs of capital.
In order to generate a beta for a certain stock, the returns for the stock are regressed against the overall index’s returns, for instance, the NASDAQ.
The beta is the risk for the stock as compared to the index or the market.
This can be shown as the slope of the line in a CAPM model.
The dependent variable or Y for the stock in the model would be its return, and the market risk premium would be the independent variable or X.
Sometimes more variables are added to the capital asset pricing model in order to obtain a more accurate estimate of potential returns.
These may include recent returns, the market capitalization of stock, and valuation ratios.
The Origin of the Term Regression
There are disagreements as to the origin of the term regression.
The term is thought to have been applied to the technique described in this article by Sir Francis Galton.
He used the term when describing the statistical attribute of some biological data to regress to some mean level.
What Are the Uses of Regression?
Regression is used to analyze the relationship between two or more variables.
Regression analysis can also determine the strength of the relationship and whether or not it is statistically significant.
The technique is often used for forecasting and predicting.
How is a Regression Model Interpreted?
The output of a regression model could look like this:
Y = 2.45 + 4.3X1 – 3.0X2
This is a multiple linear regression that relates a specific variable, Y, with two explanatory variables, X1 and X2. In interpreting this model, we would find that every time X1 changes by one unit, Y will change by 4.3 units if everything else remains constant.
Therefore, if X1 increases by 3, Y will increase by 12.9.
Then, if X2 is being controlled for, X1 will have this observed relationship. If X1 is being controlled for, then each time X2 increases by one, Y will decrease by three.
Additionally, since the y-intercept is 2.1, if X1 and X2 are equal to zero, the error term will be 2.45.
FundsNet requires Contributors, Writers and Authors to use Primary Sources to source and cite their work. These Sources include White Papers, Government Information & Data, Original Reporting and Interviews from Industry Experts. Reputable Publishers are also sourced and cited where appropriate. Learn more about the standards we follow in producing Accurate, Unbiased and Researched Content in our editorial policy.
Penn State "What is Simple Linear Regression?" Page 1 . October 21, 2022
Harvard Business School "WHAT IS REGRESSION ANALYSIS IN BUSINESS ANALYTICS?" Page 1 . October 21, 2022