Quantity SuppliedThe number of goods or services producers are willing to supply at a specific market price


What Is Quantity Supplied?
Quantity supplied is the number of goods or services producers are willing to manufacture/supply at a specific market price.
This is in contrast to the total supply, which is the actual amount of produced and supplied items in the market at different price points.
The price elasticity of supply refers to the supply changes with respect to a change in the product price.
Understanding Quantity Supplied
Quantity supplied relies on the specific product price in the market. As the product price increases in a free market, so does the production supply, or vice versa.
The total current supply of finished goods serves as a limit since eventually, prices will increase and producers will be encouraged to increase the amount of their production.
In such cases, when there is a continued demand for a product or a service, it spurs additional investment in expanding the production of said product or service.
One of the factors that affect a price decrease that reduces the quantity supplied is the lack of production budget of the manufacturer/supplier.
There are situations that force suppliers to sell their products at a loss due to cash constraints.
Examples of these include producers of oil barrels and meat growers.
Industries that produce these commodities cannot cease their operation quickly because of the complexity of their operations, and other factors like the timeline of storage limits.
They simply cannot wait for prices to improve.
Quantity Supplied Under Regular Market Conditions
One way to determine the optimal quantity supplied is by plotting the supply and demand curve in one graph.
The x-axis constitutes the supply, while the y-axis is the demand. The amount that fully satisfies current demand at current pricing is the optimal quantity delivered.
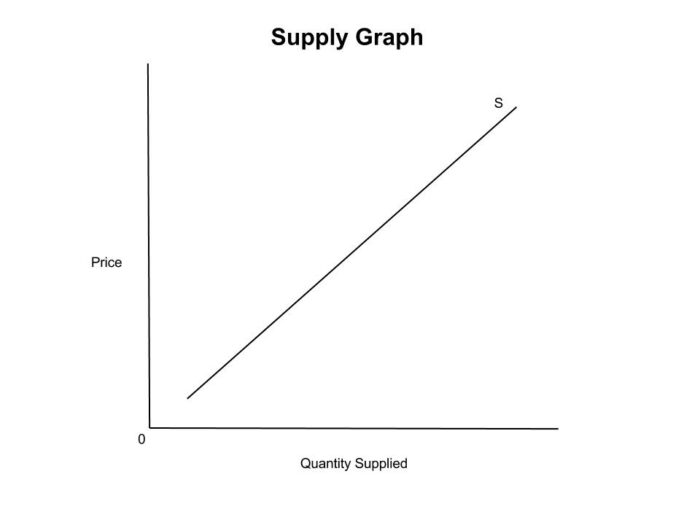
The graphical representation of the supply curve is an upward slope, which describes the willingness of producers to continue to produce and supply goods as long as the current market price increases.
As producers of goods and services are willing to supply more when the prices are up, the supply curve is shown as an upward slope.
Since consumers have lesser demand when the prices are up, the demand curve is shown as a downward slope.
The supply and demand curves intersect at the equilibrium price and quantity.
The interaction point is also called the price point – the point where the total actual supply and demand meet.
The price point also determines the quantity of market equilibrium. The supplier may generate a low-profit margin if it only produces a few quantities.
And if it produces a large number of products, a possible number of items will be left unsold.
Factors that Impact the Supply Curve

The components that influence the supply curve are the following: technology, production costs, and the price of other goods.
Technology
Technological advancement plays a significant role when it comes to production efficiency. It can cause a rightward movement of the supply curve resulting in a positive effect on the supply curve.
If the company does not invest in technological enhancement, it may negatively affect its economic standpoint and production process resulting in a leftward movement of the supply curve.
Production Costs
The second factor affecting the supply curve is the production cost. An increase in production cost limits the production ability of the company.
Production cost has an inverse effect on to supply curve. As the product price increases, the supply decreases, or vice versa.
Examples of production costs are raw materials, direct labor, and manufacturing overhead. As the production cost like the cost of materials, labor, or other related costs decreases, the company’s ability to produce products increases.
Price of Other Goods
The producers of goods or services heavily rely on the product’s current prices.
The current price determines the supply curve for the given period. There are also other goods that also affect the supply curve: producer substitutes and joint products.
Joint products are two or more products produced using the same material and are processed together.
In contrast, producer substitutes are by-products from the same materials used.
An example of joint products is leather and beef coming from a steer. The price of the good (leather) has a direct relationship with the supply of the joint product (beef).
An increase in the product’s price causes the need to raise more steers to produce more leather, with a corresponding increase in the supply of beef being the joint product.
The price of the good has an inverse effect on the producer’s substitute. For example, a string instrument maker can produce a guitar or a violin.
When the price of the guitar increases, the string instrument maker tends to make more guitars leaving the violin in few quantities.
Market Forces and Quantity Supplied
The driving force towards the optimization of quantity supplied is the market forces or market participants.
Each participant can collect information regarding price signals, and as such, they can make necessary adjustments and expectations of possible situations.
Also, the government’s decision or current situation impacts the quantity supplied of other goods or services.
Theoretically, the relationship between market forces and quantity supplied will work well if the price-setting body has accurate data on the actual demand in one economic period.
But if the price controls are far from the rates of the proximity of the market equilibrium, the consumers and suppliers may be negatively affected.
The supplier may incur a loss due to a low price ceiling, especially if that ceiling is not enough to cover the cost of production.
And if the price floor is too high, it may hurt the consumer by spending more just to buy their necessities.
Suppliers have the power to control the goods they produce and release to the market. But the product demand in the market and its corresponding prices based on the demand is out of their control.
It is favorable for suppliers whenever a product price is high and they can still sell a large number of products.
Consumers will continue to influence the price setting of the product as long as market forces are free to participate in an economic market with no restrictions or monopoly of suppliers in a given situation.
Of course, consumers are more enticed by a lower product price.
In such cases where a product is fungible, consumers may seek an alternative or substitutes.
Example of Quantity Supplied
For example, due to the pandemic, the government imposed an online class which makes laptops in demand for students to use in their online schooling.
ACEV and HB are both producers of laptops, and due to the increase in demand, ACEV increases its price per unit from $1,000 to $1,500.
ACEV can sell 50 laptops per month and earn a revenue of $50,000. The cost of production is $500 per unit, leaving a net profit of $25,000.
To increase its profitable rate, ACEV decided to follow the new price increase.
The increase in sales causes ACEV’s net profit to be $50,000 (($1,500 *50) – ($500*50)).
FundsNet requires Contributors, Writers and Authors to use Primary Sources to source and cite their work. These Sources include White Papers, Government Information & Data, Original Reporting and Interviews from Industry Experts. Reputable Publishers are also sourced and cited where appropriate. Learn more about the standards we follow in producing Accurate, Unbiased and Researched Content in our editorial policy.
University of Minnesota "Demand, Supply, and Equilibrium" Page 1. October 28, 2022
University of Hawaii " Demand, Supply, and Equilibrium in Markets for Goods and Services" Page 1. October 28, 2022