Easy Formula for Finding Z-Score in Microsoft ExcelTutorial with Screenshots


In statistics, there are a lot of benefits to using the z-score.
This helps regulate the raw score of a normal distribution, supports determining the probability of finding a given score in a standard normal distribution, and the comparison of two values/numbers in two different samples.
In this article, we will illustrate how z-score computation works in Excel.
How to Calculate the Z-score
Z-score specifies if the standard deviation is above or below a given value.
This is also called the Standard Score.
This implies that if you know the overall mean and standard deviation, you can find the z-score for every value in a given distribution.
The formula below illustrates how to calculate the z-score:
| Z = (x-µ) / σ |
Where:
- Z – a given value of the z-score
- x – a data value for what the z-score is being computed
- µ – set of data values of the mean
- σ – set of data values of the standard deviation
Calculating the Z-Score in Microsoft Excel
In Excel, there is no definite formula given for z-score, however, this is easy to formulate.
In a given data value set, you will need to find the given set using the formula given above. But first, you need to compute the standard deviation and mean.
Here is the sample data:
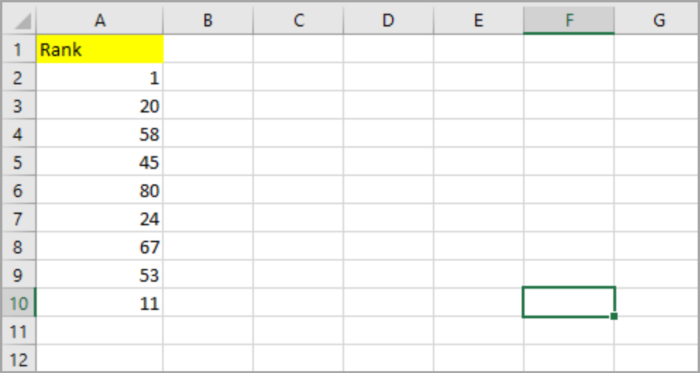
Here’s the step-by-step process for computing the z-score for each value in the dataset above.
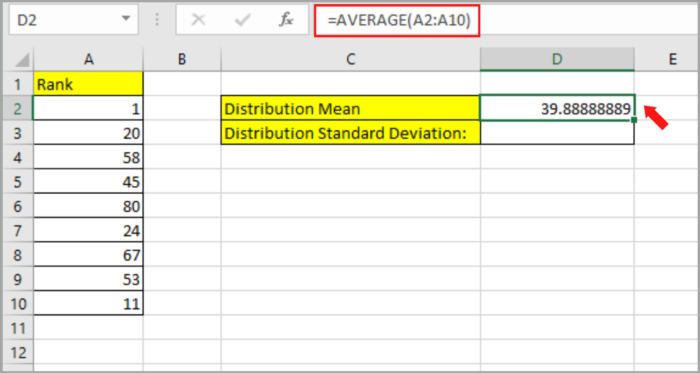
- First, you need to calculate the mean of the given dataset. By using the AVERAGE function, you can find the average of the given data set. Here is the formula that we will use in cell D2: =AVERAGE(A2:A10)

- Second, you need to calculate the standard deviation of the given data set. You can use two different functions in this problem, you can use STDEV.P and STDEV.S. You can choose between the two functions best suited for the data set. Either way, they are very similar to each other. In order to calculate the standard deviation, let’s apply this formula in cell D3: =STDEV.P(A2:A10).

Here is the definition and use of the two functions that are mentioned above:
- STDEV.P – calculates the standard deviation of the whole population. For our sample population, we will use the score of all students in a block or the sizes of all pencils created by a factory.
- STDEV.S – calculates the standard deviation of some of the samples in the population. For our sample population, we will use the scores of some of the students from a block (selected students) or some of the pencils created by a factory (quality testing).
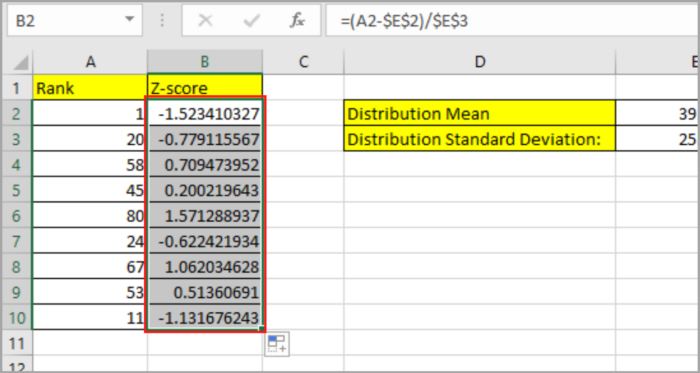
- If you now calculate the mean and standard deviation for the distribution, you can now calculate the z-score in a new separate cell/ column and place it on the right side of the data values. Input the formula in cell B2 to calculate the z-score. Here’s the formula that we will use:
| =(A2-$E$2)/$E$3 |

By dragging down the fill handle, you can copy the formula to the entire cell in the B column.
You now calculated the z-score of the entire dataset.
Interpreting the Z-Score value
If the z-score is zero (0) for that certain value, this means that it is equal to the mean.
If the z-score is positive for that certain value, this means that it is more than the mean.
To illustrate this, assuming we have a z-score of +1, this means the value of 1 standard deviation is greater than the mean, and if we have a z-score of +2, then there are 2 standard deviations greater than the mean.
However, if the z-score is negative for that certain value, this means that it is less than the mean.
To illustrate this, assuming we have a z-score of -1, this means the value of 1 standard deviation is less than the mean, and if we have a z-score of -2, then there are 2 standard deviations less than the mean.
Thus, if the z-score has a higher extent the further the value is from the mean, whether it is positive or negative.
The z-score helps us to determine how much a value departs from the mean.
In the sample dataset above, specifically in the 5th value located at A6 cell is 100, its z-score is 2.6.
Thus, it is safe to say that the standard deviation is less than the mean.
In comparing two different distributions that might have different means and variances, the z-score is very helpful if you use this method.
To illustrate this, let us compare the performance of two cricket players. One player scored 100 runs in a certain match, whereas the other scored 150 in another.
You will notice that the 2nd player is better than the 1st player by examining the difference in their score.
But there might be different conditions or scenarios in their matches.
It is possible that the opponent of the 2nd player is weaker than the opponent of the 1st player, or it could also be possible that the 1st player has an injury and the 2nd player is well.
Comparing the z-score of the two players may reveal that the 1st player did better than the 2nd player by comparing their scores in their matches.
Conclusion
This short tutorial discussed how the z-score works and its concept in statistics.
We also know how the AVERAGE function and STDEV.P/STDEV.S function work in computing the z-score for certain values.
Hope this helps you with your work!