Two Variable Data Table in ExcelLearn How to Easily Create a Two Variable Table


Excel is the perfect tool for storing and interpreting data.
With the help of Excel, it is easy to convert raw data into a powerful tool for analyzing potential outcomes, plotting trends, and making key decisions.
One particularly useful application for Excel is the two-variable data table, which can allow users to visualize results in cases where the final result is dependent upon two input variables.
By creating a table, Excel can allow users to quickly determine vast numbers of results in only moments.
In this article, we will take a look at when a two-variable data table may be the best choice and how to create these tables for your data.
When To Use a Two-Variable Data Table
A two-variable data table allows users to input two variable values into the x and y axes of a graph.
This type of table is perfect in situations where you would like to determine the potential outcomes of an event based on two potential variables.
For example, in projecting potential monthly payments for a planned loan amount, we could use a two-variable data table to represent potential monthly payments for different interest rates and the number of monthly payments.
There are many potential applications, but when multiple variables are present by finding a value to represent these sums, we can use a two-variable table to project potential outcomes.
How To Create a Two-Variable Data Table Within
Here are the steps to creating a two-variable data table in Excel.
Prepare Values for the Variables You Want To Test
The first step to preparing a two-variable data table is to determine the information you will use in the remainder of the process.
First of all, you will need to determine which variables you want to use in your table to test outcomes.
This could, for example, be to find how much interest might accrue on a given loan based on a given number of years and the value of the loan.
Set up a column for all of the values you would like to test in one column, for example, 10, 15, 20, 25, 30, 35… 50, and then set up your other value in the row above as shown below.
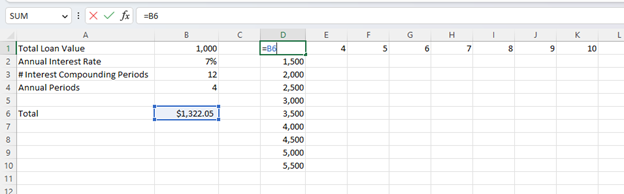
You will also need to establish information, in our case, loan information, in a series of rows like in the image below.
Finally, you will need to enter a formula for testing the outcome values.

In this case, we will use the formula =FV(B2/B3, B4*B3,,-B1) to find our potential monthly payments and the following values:
Total Loan Value: 1,000
Annual Interest Rate: 7%
# Interest Compounding Periods: 12
Annual Periods 4
Place your formula in a blank cell and then link this cell to the one located over your column of values.
Next, select your entire table of values, in our case, from D1 all the way to K10, and then navigate to the Data tab.
Here select “What If Analysis” and on the drop-down list, “Data Table.”

This will bring up the “Data Table” dialog box, and here we want to enter the cell references for the column and row inputs. In this case, we will enter B1, the total loan value for the Row Input, and B4, the number of annual periods, for the column input and hit “OK.”

This will create a table of values for each of the different potential variable values in your table.
You may wish to reformat them, such as by applying the “Currency” format; however, the results are complete and ready for analysis.
Conclusion
A two-variable data table is a powerful tool for analysis and, as you have seen, is relatively easy to create.
In a few short steps, it can automatically provide you with the results of hundreds of potential outcomes making it far easier to test for different outcomes based on two variables.