Step-by-Step Computation of Standard Error in Microsoft ExcelDefined along with Formula & How to Calculate


Microsoft Excel is one of the many efficient software that we use today.
Whether it is for school, work, or business.
The ability to do a wide range of data entry, processing, and analysis are some of Microsoft Excel’s cutting-edge features among others.
When analyzing data, you may encounter a number of statistical metrics in your work.
Means, medians, standard deviation, and standard errors are some examples of these.
Excel will be able to help you recognize the accurate interpretation of the data.
In this tutorial, we will tackle two different demonstrations of Standard Deviation Computation in Microsoft Excel.
Here, there are two methods: the first one involves using formulas and the second one involves using a tool of Data Analytics.
Let’s start!
The Standard Error / Deviation
In collecting samples from actual data or problems involving the real population of the world, it is most likely impossible to calculate using the exact whole population.
So the solution to this problem involves using a random selection of samples from the whole population.
In terms of the actual average population size, the standard deviation of a given sample states how accurate its mean is.
In short, the standard deviation of a given sample is indicated by the standard error correlated to the average population or so-called population mean.
The Standard Error is helpful in measuring the accuracy of how the sample’s average demonstrates the actual population size.
It is also helpful in evaluating the quantity of data distribution or the difference between several samples.
How do we Compute Standard Error?
To know how the Standard Error/ Deviation works, let’s take a glance at the formula shown below:

Where:
- SE is an abbreviation for the Standard Error
- σ denotes the data sample’s Standard deviation
- n denotes the data sample’s population.
Finding the Standard Error in Microsoft Excel by Formula
In comparison with the Standard Error, unfortunately, Excel doesn’t have an integrated formula for its Standard Error computation.
Not until you have this tutorial.
Here are the steps to easily compute the standard error using the formula given earlier.
- First, click the cell that you want the Standard Error to be placed in, then locate and click the formula bar right next to the fx symbol near your toolbar.
- Type equal symbol (=). And the input: =STDEV(
- Select the range and then drag the sample that you need. This action will be present in your formulation. For example, our range is from B2 to B10 so the formula is now =STDEV(B2:B10. In finding the Standard deviation, STDEV function is now used. Now, close the STDEV formula using a bracket =STDEV(B2:B10).
- Divide the Standard deviation using the square root of the sample size. So this is our formula. After closing the formula using a closing bracket, let’s follow it up using the “/” symbol to indicate that we will divide the result. Now our formula is: =STDEV(B2:B10)/.
- For the square root, we will use the SQRT( formula by typing it next to the previous formula. Now our formula is: =STDEV(B2:B10)/SQRT(.
- For the sample size, we will use the COUNT( function by typing it next to our current formula. After that select and drag the range of the cells with the data that you want to use in your sample size.
- Now close it using the closing bracket for the SQRT function. This is now our current formula” =STDEV(B2:B14)/SQRT(B2:B10)).
- Finish it by pressing the Enter Key. And these are the steps in calculating the sample’s Standard Error.
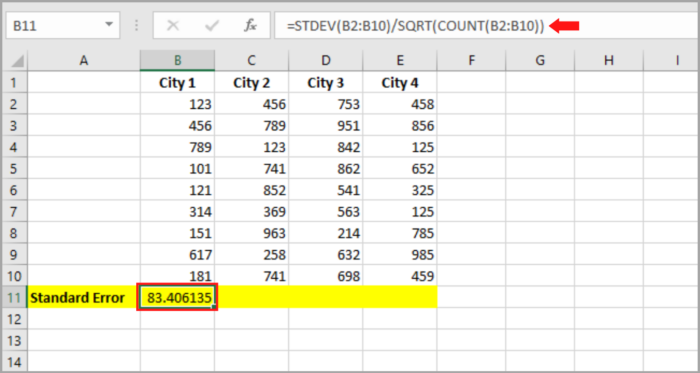
In that example, we successfully calculated our Standard Error for our samples.
As you can see in the picture above, we only calculated the Standard Error of the sample in one column (B column).
If you want to apply the formula in another column, you can simply select the result in column B and then drag the fill handle to the right.
This is how you can copy and apply it to another column in each sample.


Finding the Standard Deviation in Microsoft Excel by Data Analysis Pack
There is another way in computing Standard Error.
This method does not use a formula but uses statistical metrics needed to analyze your given sample data.
In this method, we will install the Data Analysis ToolPak.
This will give you access to different varieties of statistical functions.
This package includes z-test, correlation functions, and t-test functions.
After installing the software, you can use it anytime and never have to reinstall it again.
This is free and it comes with your Microsoft Excel package, but you need first to activate this feature for you to use it.
A simple process for activating your Data Analysis Toolpak is shown below:
- Go to the File tab and click on options.
- In this option, you will see “add-ins” in the sidebar. Click it.
- Click on the Analysis Toolpak.
- In the bottom part of the window, select the “Go” button.
- Select the checkmark for Analysis ToolPak and lastly select the OK button.
Using this step, you can now see your Data Analysis ToolPak on your Toolbar.
From this point on, you will now see the Data Analysis in the Data Tab.

So now, using the other Statistical Metrics, let’s find out the Standard Error.
Here are the steps:
- Go to the Data tab, and click the Data Analysis tool. You will see the Analysis Tools dialog box.
- Click on “Descriptive Statistics”, and hit the OK button.
- Locate the range of cells that contains the sample data, then put it into the “Input Range” box or simply drag and select the range of data. You can now use this on every column of each sample.
- Check the “Label in First row” if the data have column headers.
- Click the cell where you want the result to be located. Select “New Worksheet” this will be displayed on the newly created worksheet, and this will not be disturbing your present worksheet.
- Tick the checkbox beside the “Summary Statistics” and select the OK button.

In a new worksheet, all your analytical metrics will be displayed.
As you can see in the picture below you will have different Analytical metrics including the Standard error for your sample data.

Conclusion
In this tutorial, we demonstrated two ways where you can find the Standard error for your given sample data.
The first method is where you can use formulas to compute the standard error and the second is using a different analytics tool, which in our example is Data Analysis ToolPak which can generically be used in Excel.
Both ways can be used and can be reliable in calculating the Standard error of the sample data.
Thank you and we hope this tutorial helped!