Quick and Simple Guide to Run Excel Descriptive StatisticsStep by Step Instructions with Screenshots


Descriptive Statistics is particularly useful for people who work with huge datasets.
What it does is it allows users to have a summary of the data sets they are working on with data points that helps them fully comprehend the information in front of them.
There is of course an option to calculate the values one by one, but why go through manual computation when you have the option to run Descriptive Statistics that will provide the information you need in one place?
Let us go ahead and start with how we can use Excel’s Descriptive Statistics.
Descriptive Statistics
Before you can start to use Descriptive Statistics, you must first have to enable the Data Analysis Toolpak.
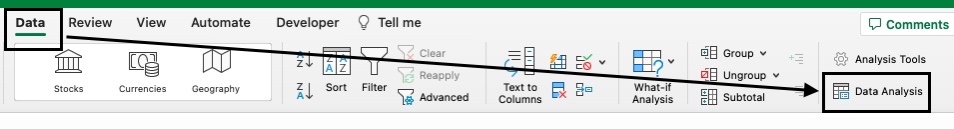
If you’re not sure whether this is already enabled, you can go ahead and check it through the Data tab.
![]()
![]()
Once you have clicked on the Data Tab, you should be able to see Data Analysis if the Toolpak is already enabled. If you don’t see it yet, it means it is disabled.
The steps in the next section will help you enable the Toolpak in case you don’t see it in your Data tab yet.
Enable the Data Analysis Toolpak
Follow these steps to activate your Data Analysis Toolpak:
- Open Microsoft Excel.
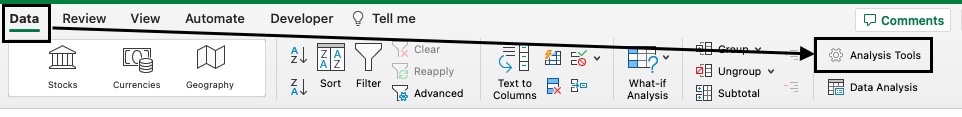
- Go to the Data Tab. Click on the gear icon that says Analysis Tools.

- You will be able to see the add-ins that are available – Data Analysis Toolpak included. Click on the box to the left of it to enable it.


- Click OK.
Once enabled, you will now see this each time you open Excel under the Data tab.
Obtain the Descriptive Analysis
With the Toolpak enabled, we can now proceed to use this in getting your dataset’s Descriptive Statistics.
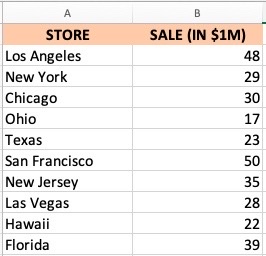
Let us take the below data as an example and use this to determine its Descriptive Statistics. It shows the sales information of a store’s different branches.
Here are the steps for obtaining the Descriptive Statistics:
- Go to the Data tab and click on Data Analysis.


- In the Analysis Tools that pop up, click on Descriptive Statistics and then click on OK.


- The Descriptive Statistics dialog box will pop up. In the input range, select the data values located in Column B. The analysis will only be able to process numerical values.
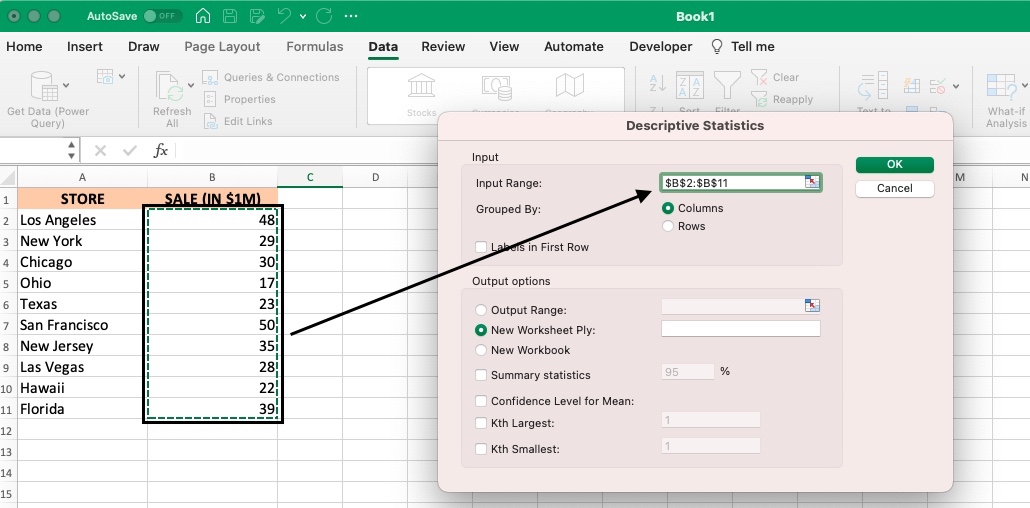

- Click on the box to the left of ‘Labels in First Row’ if your dataset contains a header.
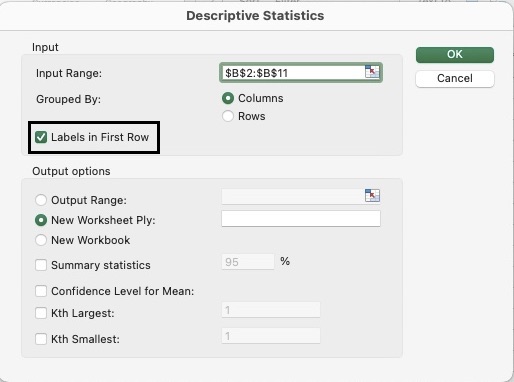

- To get your result in a fresh worksheet, click on ‘New Worksheet Ply’.


- Finally, select the statistical analysis you wish to obtain. You will have to select at least one, but you may also select all four. You can then proceed to click on OK.


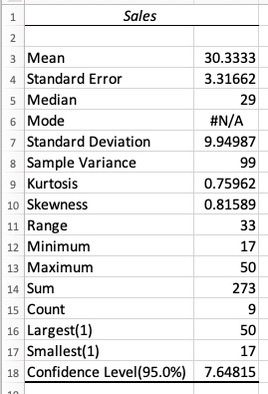
In a new worksheet, you will be able to see the result of the statistics you have selected.
In the 6th step, there is an option to modify the statistical result that you need. For example:
- You can change the summary statistics from 95% to 80%.
- You can set the Kth larges to 5 and it will present you with the dataset’s 5th largest value.
- In the same way as the point above, if you set the Kth smallest to 5, you will be presented with the dataset’s 5th smallest value.
Important Note: If you change the values of the dataset, you have to go through the steps again to get the Descriptive Statistics since the values are static.
Conclusion
It is relatively easy to get the Descriptive Statistics of your datasets.
You no longer have to manually calculate them individually next time.
I hope you have learned a lot from this tutorial.