How To Calculate Cumulative Percentage in Excel3 Easy Ways!
A cumulative percentage is a good way to analyze or express a frequency distribution.
If you determine the cumulative percentage, you will be able to see what percentage of values occurring in your distribution are higher or lower than a certain value.
We will explain how cumulative percentage is used in this article and show you three ways to calculate cumulative percentage in Excel.
Explaining Cumulative Percentage
Cumulative percentage is a way of expressing a frequency distribution and calculates the percentage of cumulative frequency within each interval.
As values are added, the cumulative percentages will increase, and the final value listed in the frequency distribution will have a cumulative percentage of one hundred percent.
As an example, a dart player is curious about which part of the board she hits most often.
So she throws a dart 60 times. The following table displays the frequency distribution.
| Number | Frequency | Cumulative Frequency |
| 1 | 2 | 2 |
| 2 | 3 | 2 + 3 = 5 |
| 3 | 3 | 3 + 5 = 8 |
| 4 | 7 | 7 + 8 = 15 |
| 5 | 6 | 6 + 15 = 21 |
| 6 | 2 | 2 + 21 = 23 |
| 7 | 2 | 2 + 23 = 25 |
| 8 | 2 | 2 + 25 = 27 |
| 9 | 2 | 3 + 27 = 30 |
| 10 | 3 | 3 + 30 = 33 |
| 11 | 3 | 3 + 33 = 36 |
| 12 | 3 | 3 + 36 = 39 |
| 13 | 1 | 1 + 39 = 40 |
| 14 | 4 | 4 + 40 = 44 |
| 15 | 4 | 4 + 44 = 48 |
| 16 | 2 | 2 + 48 = 50 |
| 17 | 3 | 3 + 50 = 53 |
| 18 | 1 | 1 + 53 = 54 |
| 19 | 4 | 4 + 54 = 58 |
| 20 | 3 | 3 + 58 = 61 |
Once we find the frequency distribution for each possible result, we could say how many throws landed between, say, one and five.
If we were to calculate the cumulative percentage, it could tell us how likely the person is to have the dart land on the numbers one through five.
Calculating the Cumulative Percentage Manually
First, we will show how to compute the cumulative percentage manually.
For this example, we will use a frequency distribution of the number of furnaces some salespersons sold in a quarter.
| Vacuums Sold | Frequency |
| 25 | 3 |
| 27 | 4 |
| 32 | 7 |
| 41 | 4 |
| 50 | 2 |
Once you have recorded the vacuums sold and the frequency of the occurrence, you will need to calculate the cumulative frequency for each sales figure.
When calculating cumulative frequency, you will add the frequency of the units sold for which you are calculating to the frequency of previous units sold.
Here is a chart showing how this is done.
| Vacuums Sold | Frequency | Cumulative Frequency |
| 25 | 3 | 3 |
| 27 | 4 | 3 + 4 = 7 |
| 32 | 7 | 7 + 7 = 14 |
| 41 | 4 | 4 + 14 = 18 |
| 50 | 2 | 2 + 18 = 20 |
Once you have calculated the cumulative frequency, the cumulative percentage can be computed as shown in the chart below.
| Vacuums Sold | Frequency | Cumulative Frequency | Cumulative Percentage |
| 25 | 3 | 3 | 3/20 * 100 = 15% |
| 27 | 4 | 3 + 4 = 7 | 7/20 * 100 = 35% |
| 32 | 7 | 7 + 7 = 14 | 14/20 * 100 = 70% |
| 41 | 4 | 4 + 14 = 18 | 18/20 * 100 = 90% |
| 50 | 2 | 2 + 18 = 20 | 20/20 * 100 = 100% |
This would mean if someone wanted to know the cumulative percentage of the 27 vacuums sold, it would be 35%.
Calculating Cumulative Percentage by Using Manual Computation in Excel
If you want to compute the cumulative percentage, you do not have to do it manually.
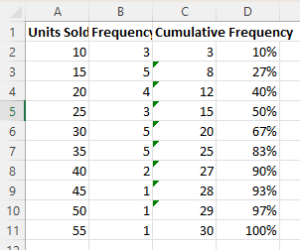
You can use Excel instead. In fact, there are three ways to compute cumulative percentages in Excel. Here is the frequency distribution table we will use for all three of the following methods.
- Manual computation
- A formula
- Pivot table
We will show you how to compute cumulative percentage in Excel using these three methods.
First, we will calculate the cumulative percentage in Excel with manual computation.
The method we will use first to compute cumulative percentage is a basic manual computation.
This Excel method makes it easier to see how the cumulative percentage is calculated.
However, before we can calculate the cumulative percentages, we must find the cumulative frequencies.
To do this, you:
- Start a column to compute the cumulative frequencies. Label column C as Cumulative Frequency and type this formula into cell C2: =SUM($B$2:B2. You should also lock cell reference B2 as an absolute reference so that as the formula is copied to other cells in the column, the value will be added from cell B2 throughout the rest of the column.

- Once you have placed the formula into cell C2, use the fill handle to copy the formula into the remaining cells in the column.

- After completing the last step, column C should contain the cumulative frequencies for each of the sales figures. The last number in the column will be the total frequency.
- Next, you will create a column that you will use to calculate the cumulative percentages.
- Then, in column D2, type this formula: =C2/$C$11. This will divide the cumulative frequency of the sales figures by the figure for total frequency. Be sure to lock cell C11 as the cell reference by using dollar symbols in order to ensure that when you copy the formula to the other cells in column D, the reference will remain the same.
- Copy the formula to the remaining cells in column D using the fill handle.

- Once you copy the formula into the other cells, you will notice that they are not listed as percentages. To change these numbers to percentages, select the numbers from D2 through D11. Then, go to the Home Tab and find the Numbers Group. Click the button for Percent Style.
- You should now find all the values in column D listed as percentages. These are the cumulative percentages of the sales figures. If the last value in the column is 100%, the calculations were done correctly.

Calculating Cumulative Percentage with a Formula
We can use a different formula to calculate the cumulative percentage.
In this formula, we will use the SUM functions to calculate the cumulative percentage without the need for a helper column.
Here is the formula you can use:
=SUM($B$2:B2)/SUM($B$2:$B$11)
Just type the formula into the first cell in the cumulative percentage column.
Then, use the fill handle to copy the formula into the remaining cells in the column.
Once you do that, change the values into percentages by using the same procedure you used in the previous method.
This method is generally more convenient than the previous method since you can obtain the same information in fewer steps.
Calculating Cumulative Percentage in Excel by Using a Pivot Table
The last method we will explain for calculating the cumulative percentage is using a Pivot table.
This method has the advantage of having several data analysis tools that can be used in addition to finding the cumulative percentage.
The first thing you’ll need to do when using this method is to create your Pivot table. Here is how to create a Pivot table.
- Select the cells your data is in. For our example, this would be cells A2: B11.
- Now, go to Insert and click on Pivot table.
- You should see a dialog box. Next, decide if you want the table in a new worksheet or the existing worksheet. A new worksheet is generally the better choice. Once you make your selection, click okay.

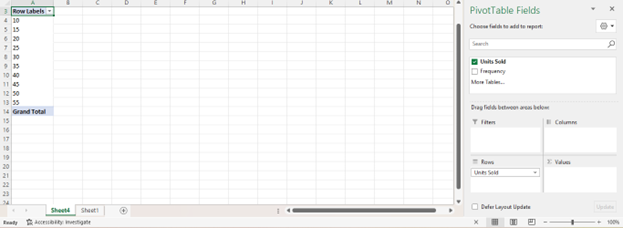
- Then, you should have a Pivot table on your worksheet and a sidebar with the PivotTable Fields off to the right of the Excel window.

- Now you can drag the Units Sold field and place them in the Rows area.
- Then drag the Frequency field and place it in the Values area.
- Your Pivot table should now contain the Sales figures along with a Sum of Frequency column.
But we don’t need a Sum of Frequency column. We need to have a Cumulative Percentage of Frequency column.
We can do this by doing the following.
- Locate the Sum of Frequency Heading and double-click it.
- You should then see the Value Field Setting Dialog box.
- In the Custom Name field, replace “Sum of Frequency” with “Cumulative Percentage.”
- Go to the Show Values As tab and choose “% Running Total In” from the options in the drop-down list and click on okay.
- The “Sum of Frequency” column should now be named “Cumulative Percentage” and have the cumulative percentage for each sale’s figure.

This method will provide the same results as the other two methods.
All three of these methods will work to compute the cumulative percentage for you.
So, feel free to use the one that works best for you.
